UX Case Study
Visual authoring interface for AWS Glue Studio
Amazon Web Services, 2019-2021
UX Case Study
Visual authoring interface for AWS Glue Studio
Amazon Web Services, 2019-2021
UX Case Study
Visual authoring interface for
AWS Glue Studio
Amazon Web Services, 2019-2021
UX Case Study
Visual authoring interface for
AWS Glue Studio
Amazon Web Services, 2019-2021
UX Case Study
Visual authoring interface for AWS Glue Studio
Amazon Web Services, 2019-2021
OVERVIEW
The visual authoring experience is the primary, driving feature for Glue Studio. It allows users to focus on exploring, preparing, and validating their data at each step of their data pipeline with a UI. It speeds up their work and saves them money because there’s not much setup and they get immediate feedback of their work.
Overview
The visual authoring experience is the primary, driving feature for Glue Studio. It allows users to focus on exploring, preparing, and validating their data at each step of their data pipeline with a UI. It speeds up their work and saves them money because there’s not much setup and they get immediate feedback of their work.
Key takeaways
SCALING AND ADAPTING A DESIGN SYSTEM
The AWS design system didn’t have patterns and components for canvas applications or IDEs. I had to adapt the base AWS design system so it could accomodate my customer use cases. In addition, I had to design new components, patterns, and iconography to extend and scale the AWS design system.
UNDERSTANDING AND ABSTRACTING THE CODE API
One of the main pain points I was solving with this experience is the ability to create these data pipeline scripts for customers who couldn’t code. In order to accomplish that, I needed to understand and work backwards from the AWS Glue code library and translate the API into a user interface.
Understanding data pipeline authoring process
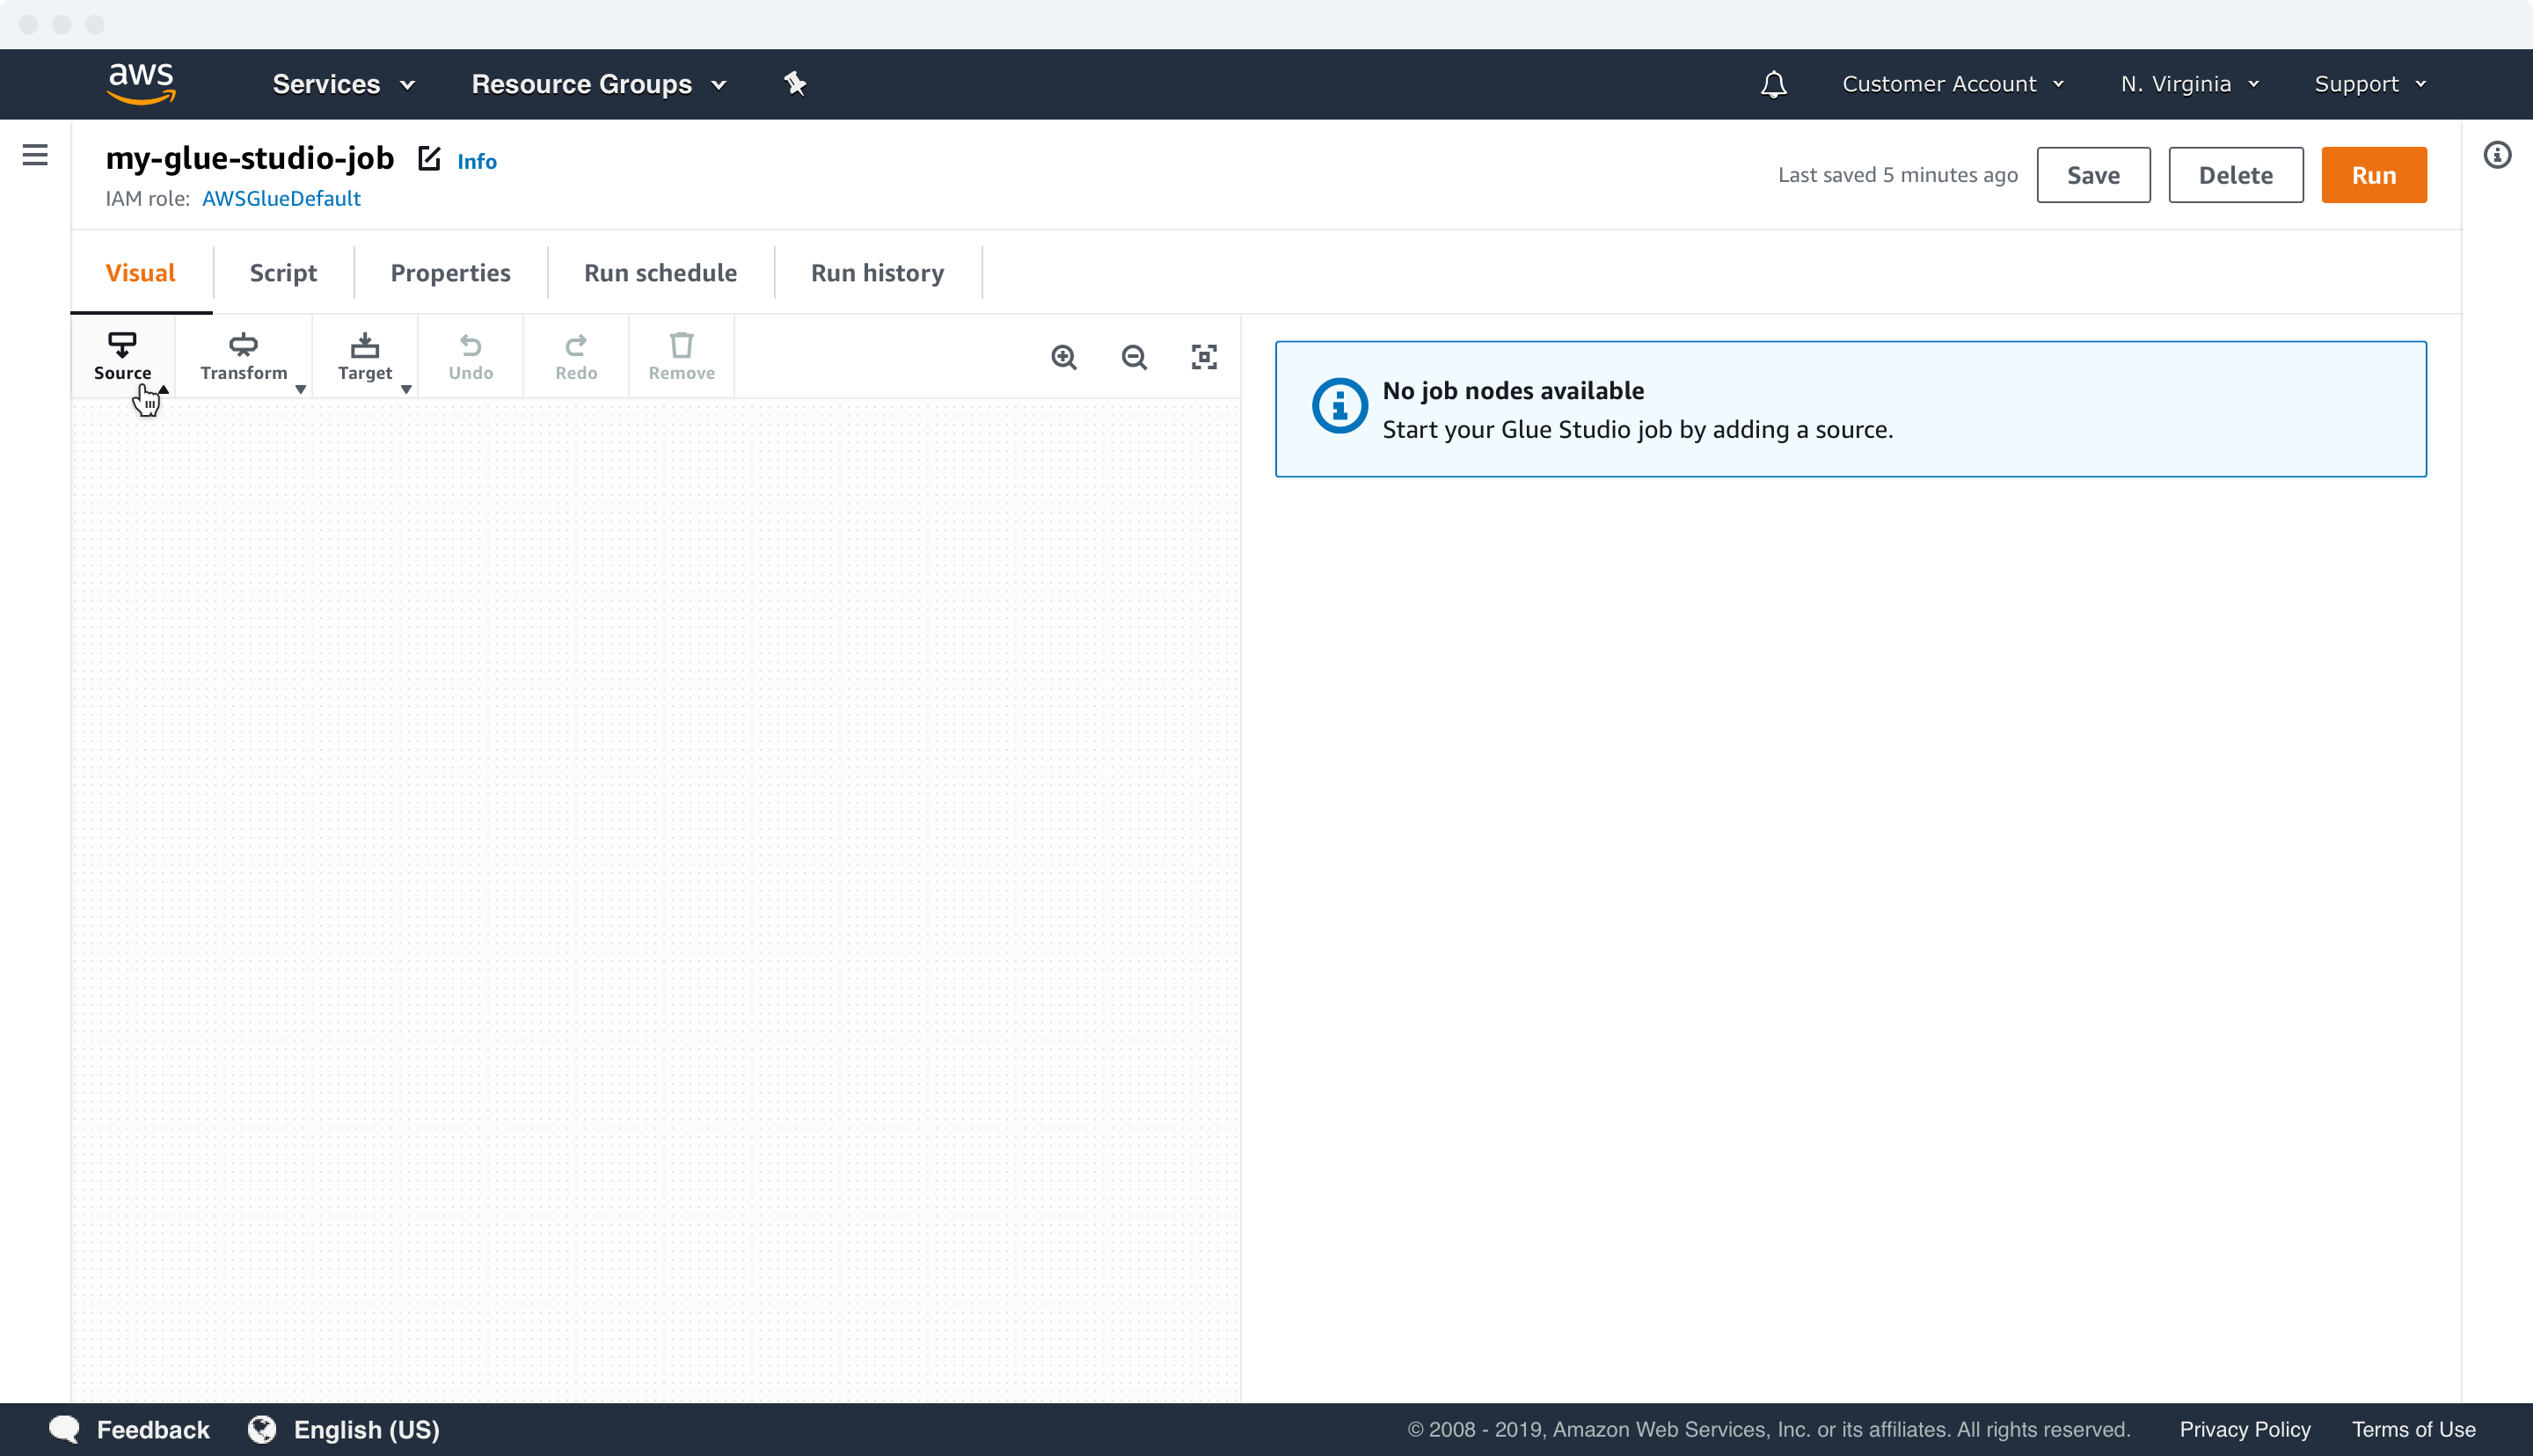
WHAT ARE DATA SOURCES, TRANSFORMS, AND TARGETS?

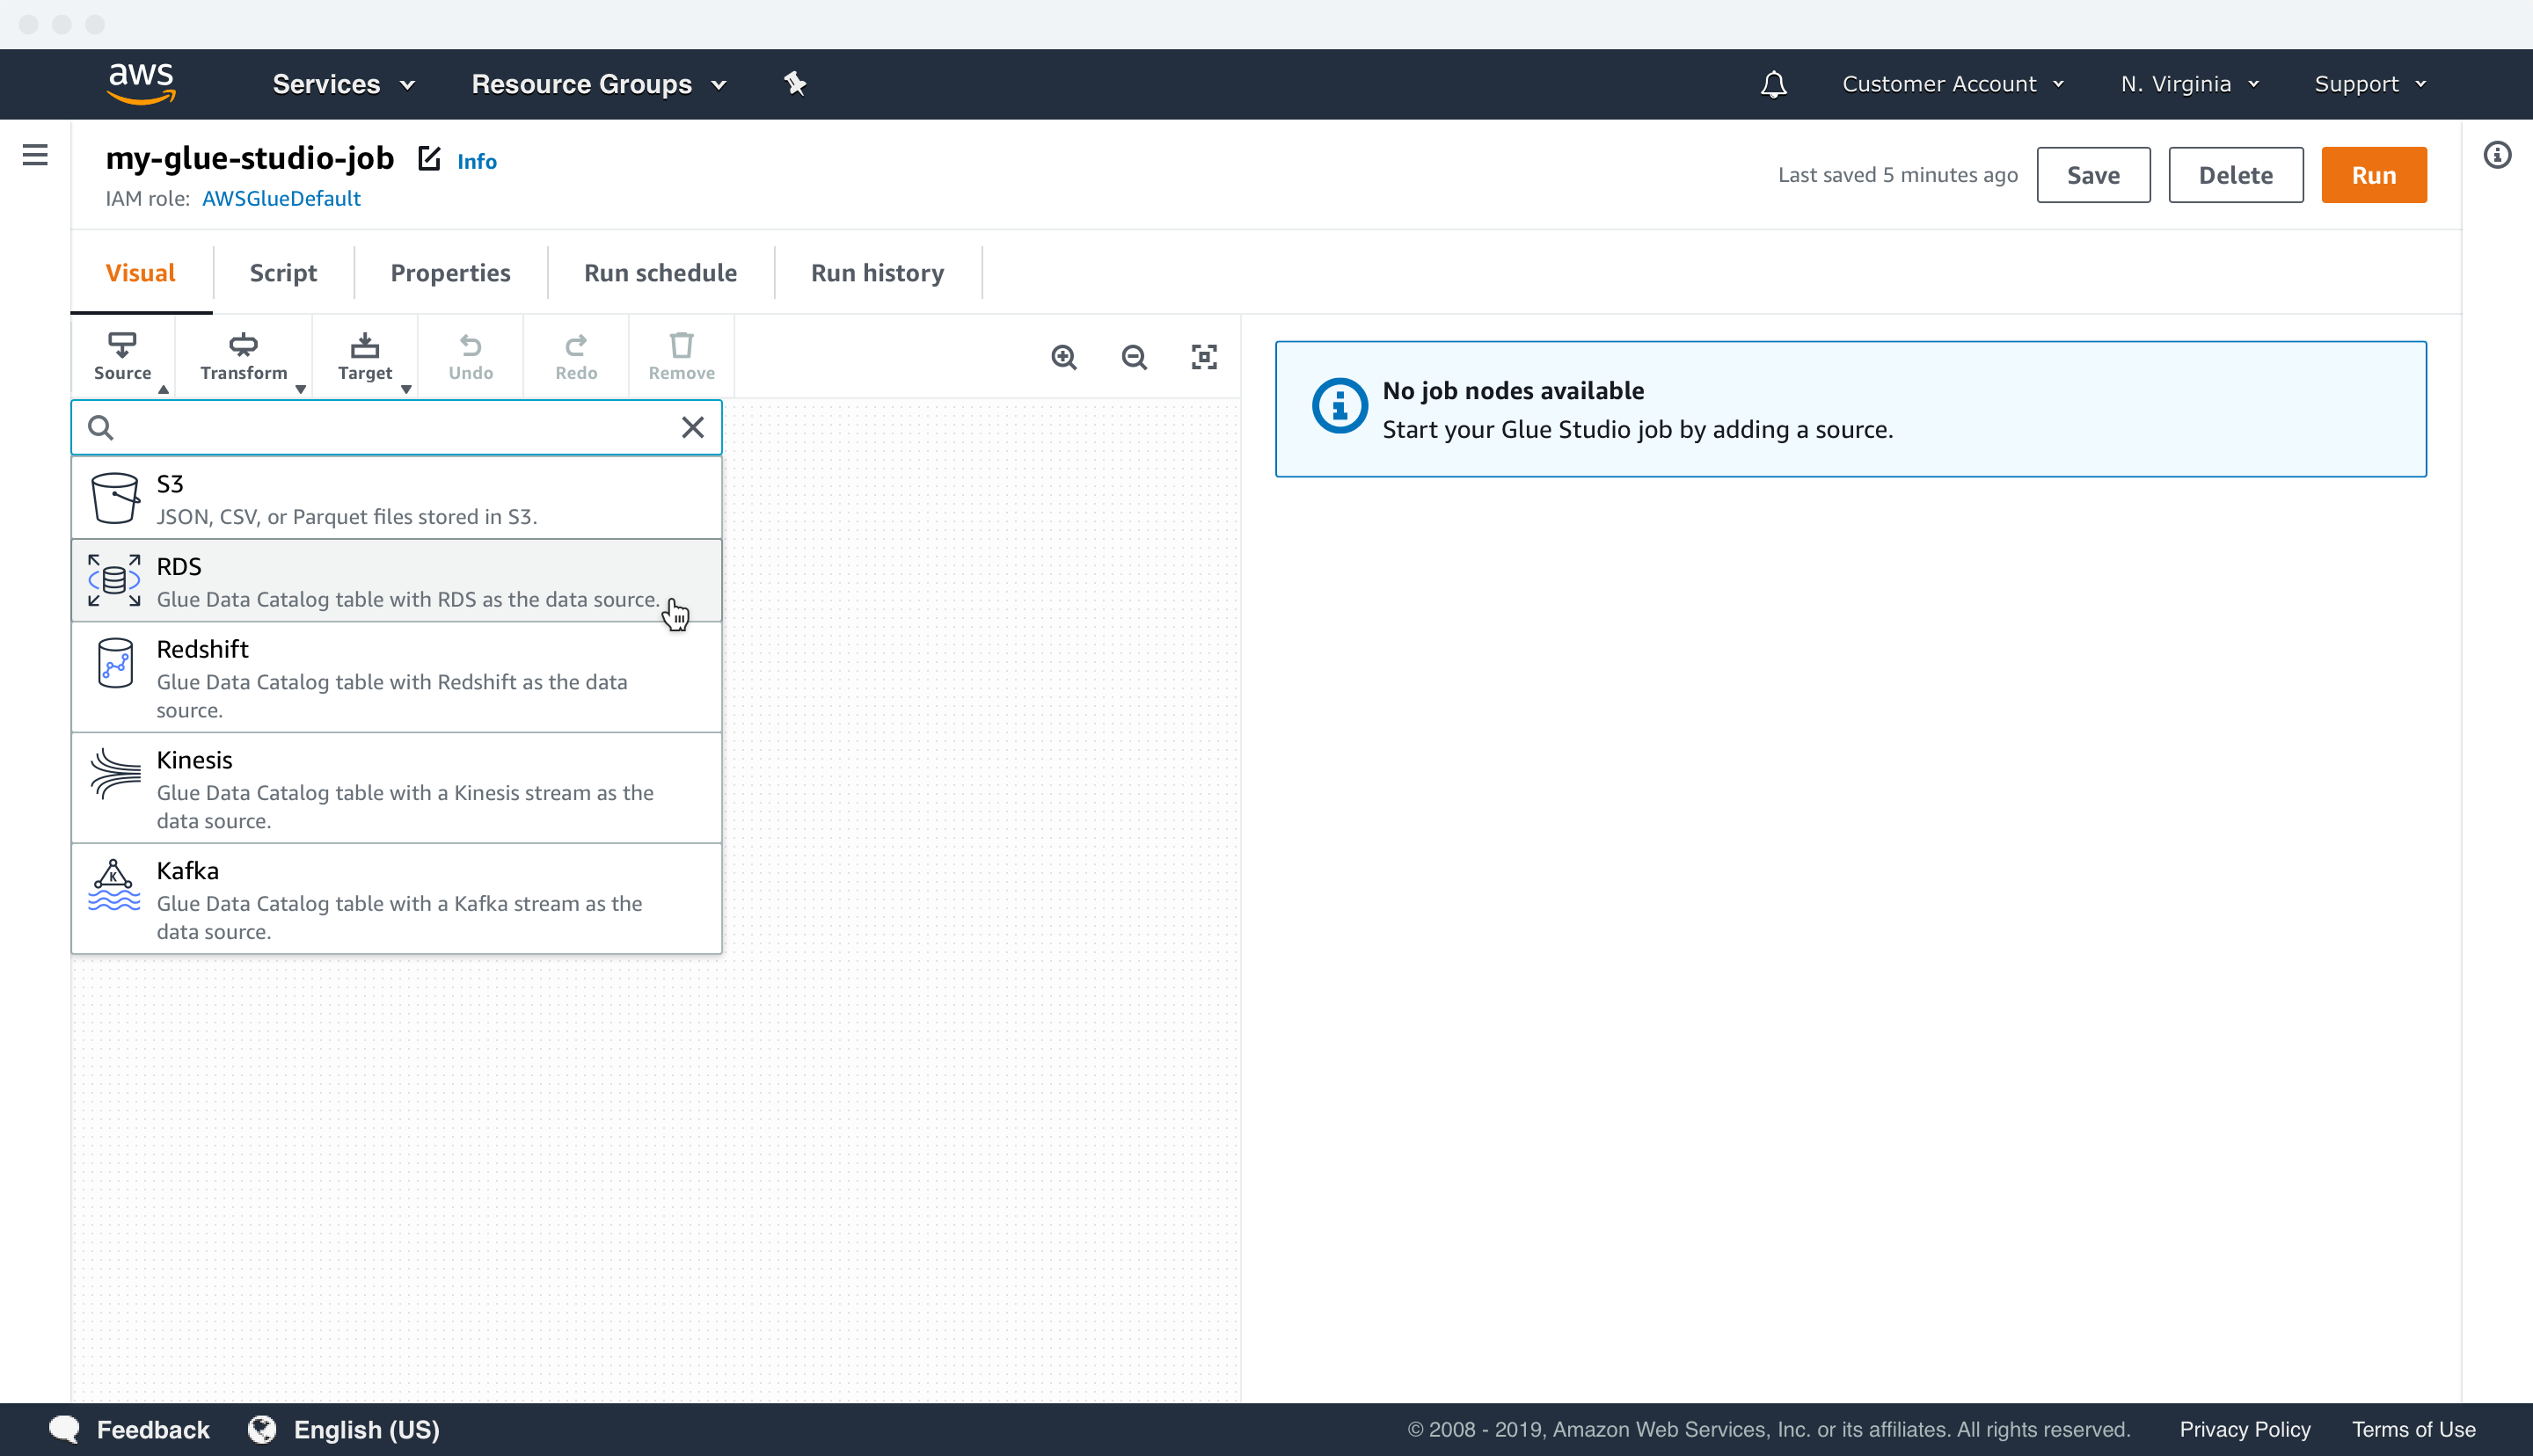
Sources
Customers typically begin with defining their data sources in the process. This is where the raw data originates. The data could be structured (CSV) or semi-structured (JSON).
A source node in a pipeline only yields a single output of data.

Transforms
Transforms are functions to manipulate the data. Customers are doing things like rearranging data structure, reducing redundancies, and improving the accuracy.
A transform node in a data pipeline can have one or two inputs and yield one or more outputs of data.

Targets
Targets are the destinations for the final data output. They can be data lakes or warehouses where the loaded data is ready for analytics and business consumption.
A target node in a pipeline has an input and does not yield any output.
WHAT IS A CUSTOMER'S THOUGHT PROCESS?
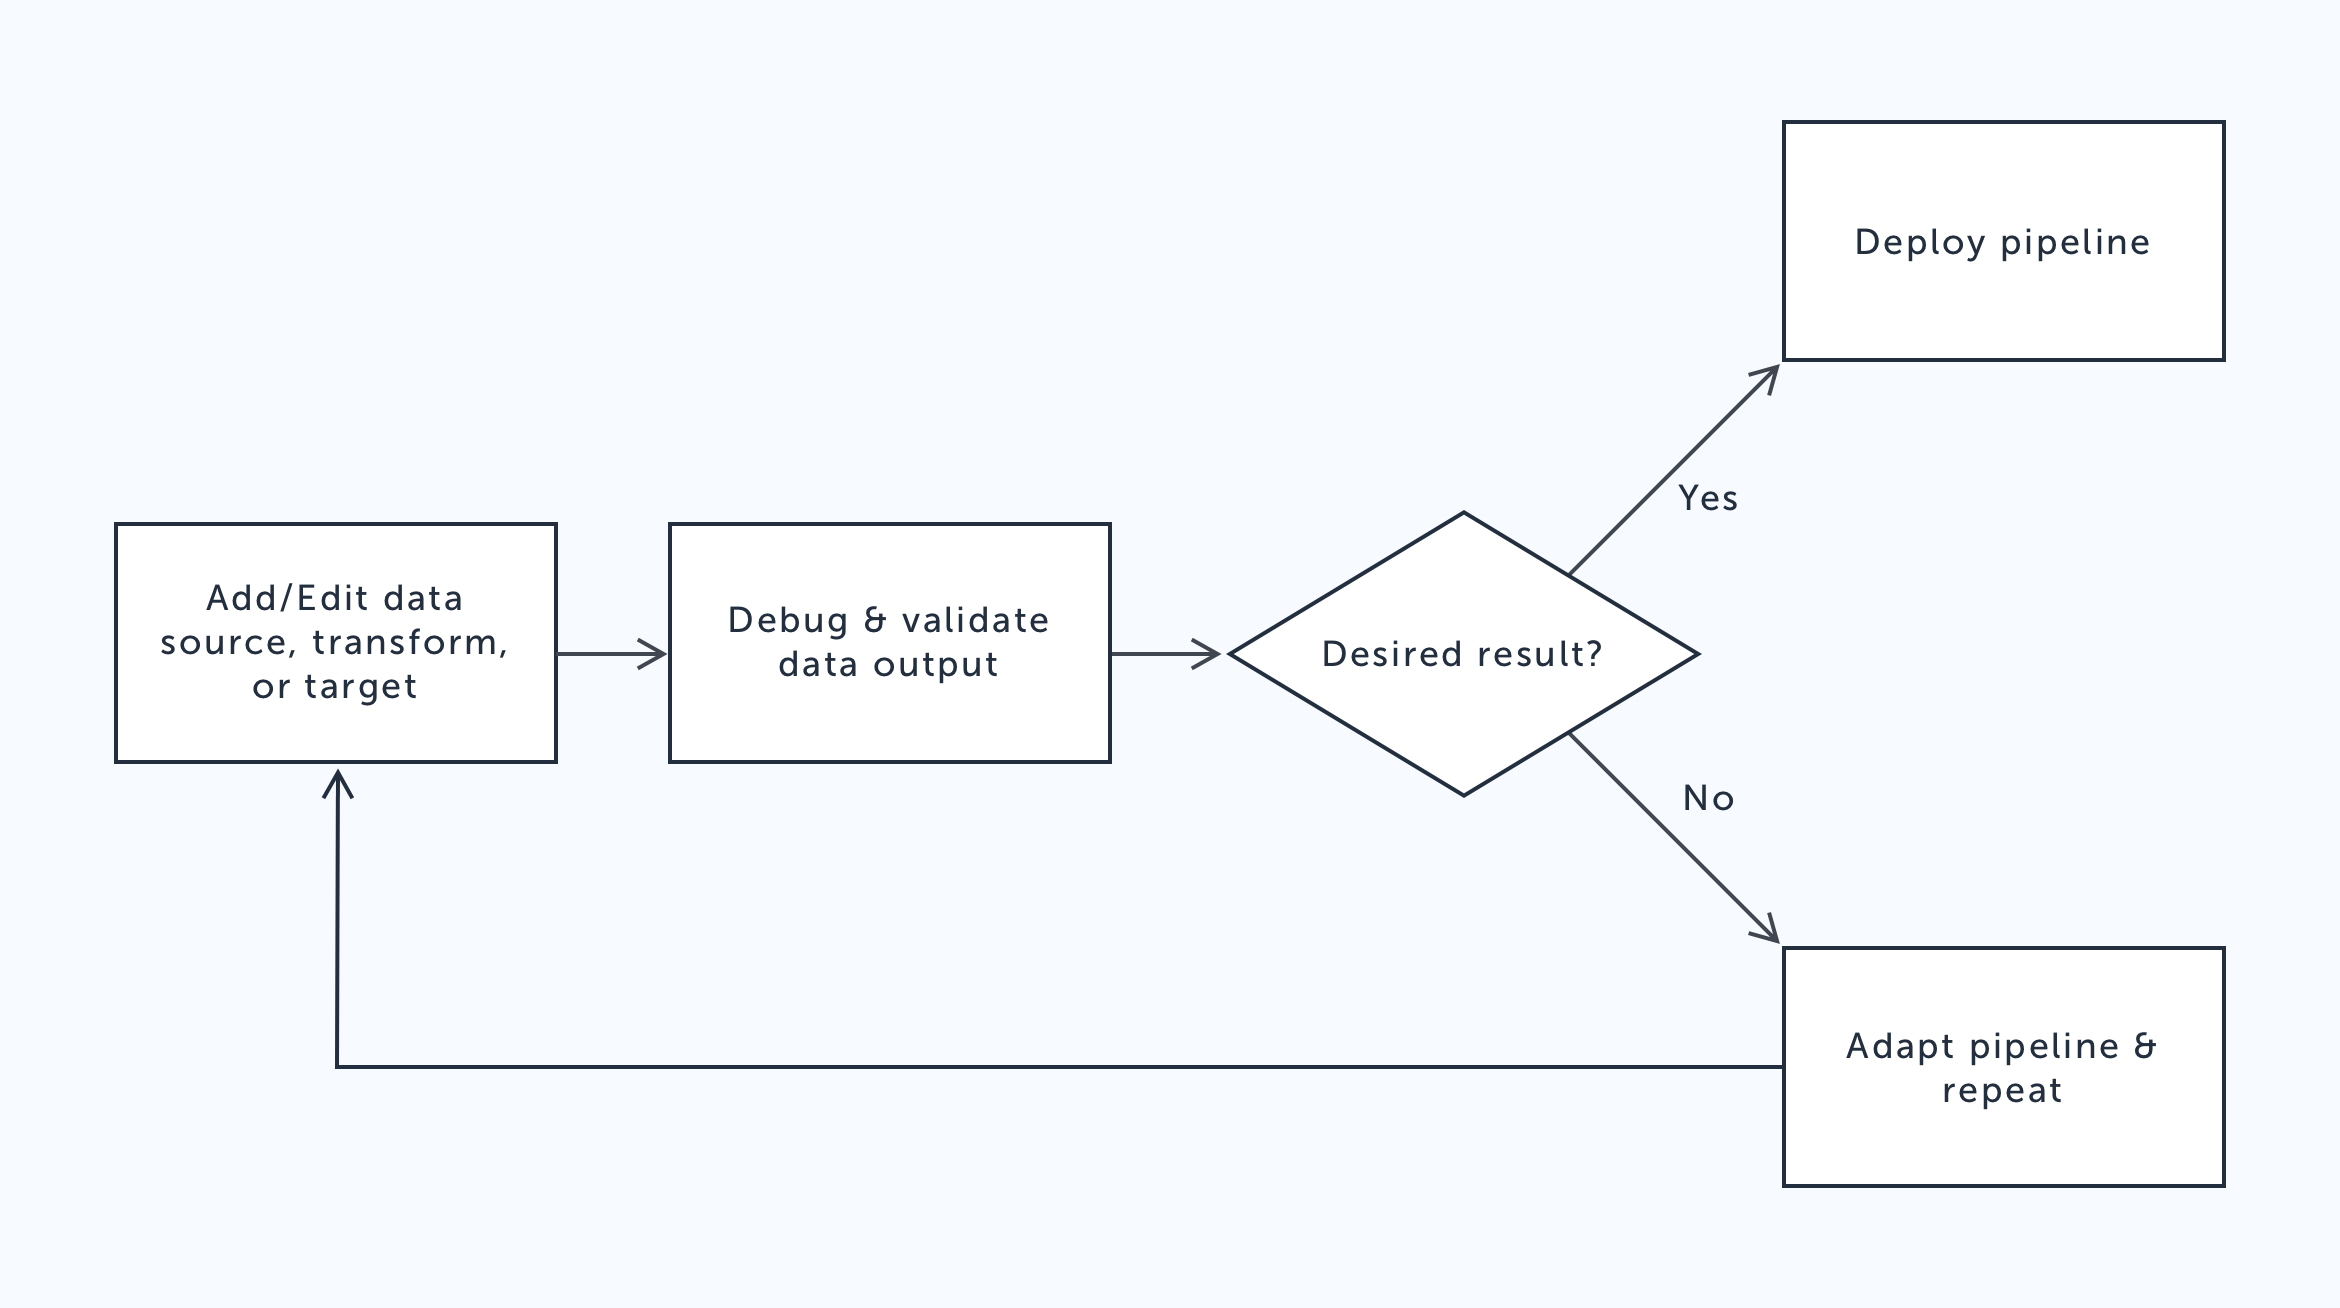
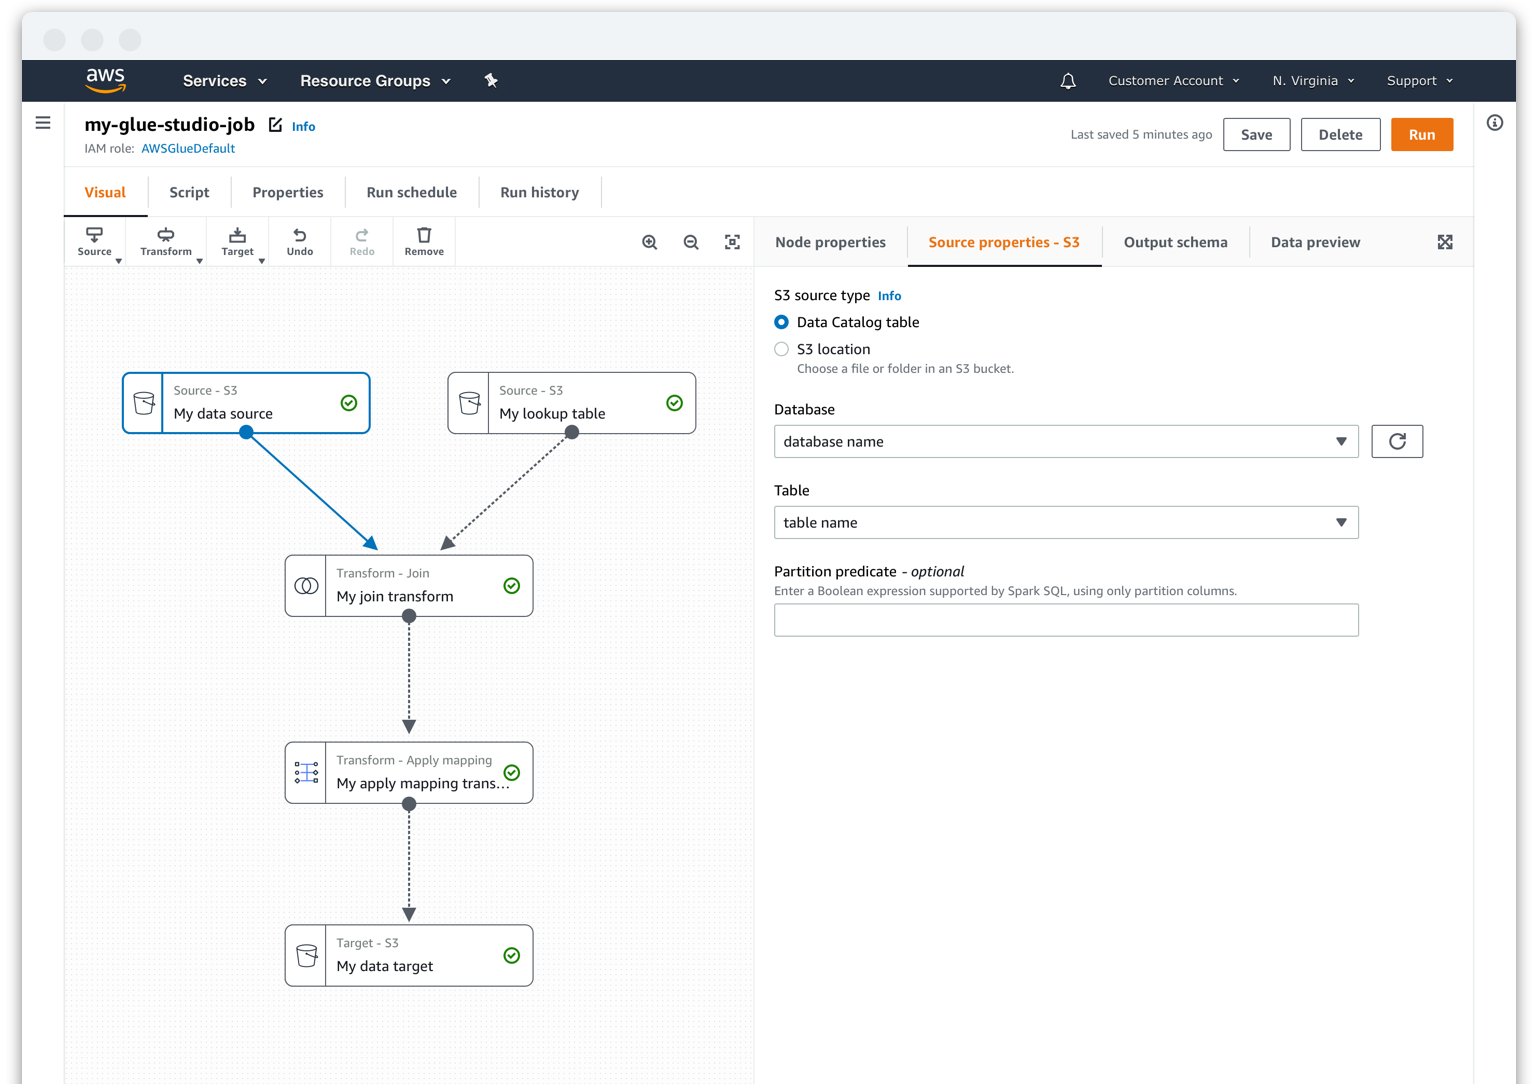
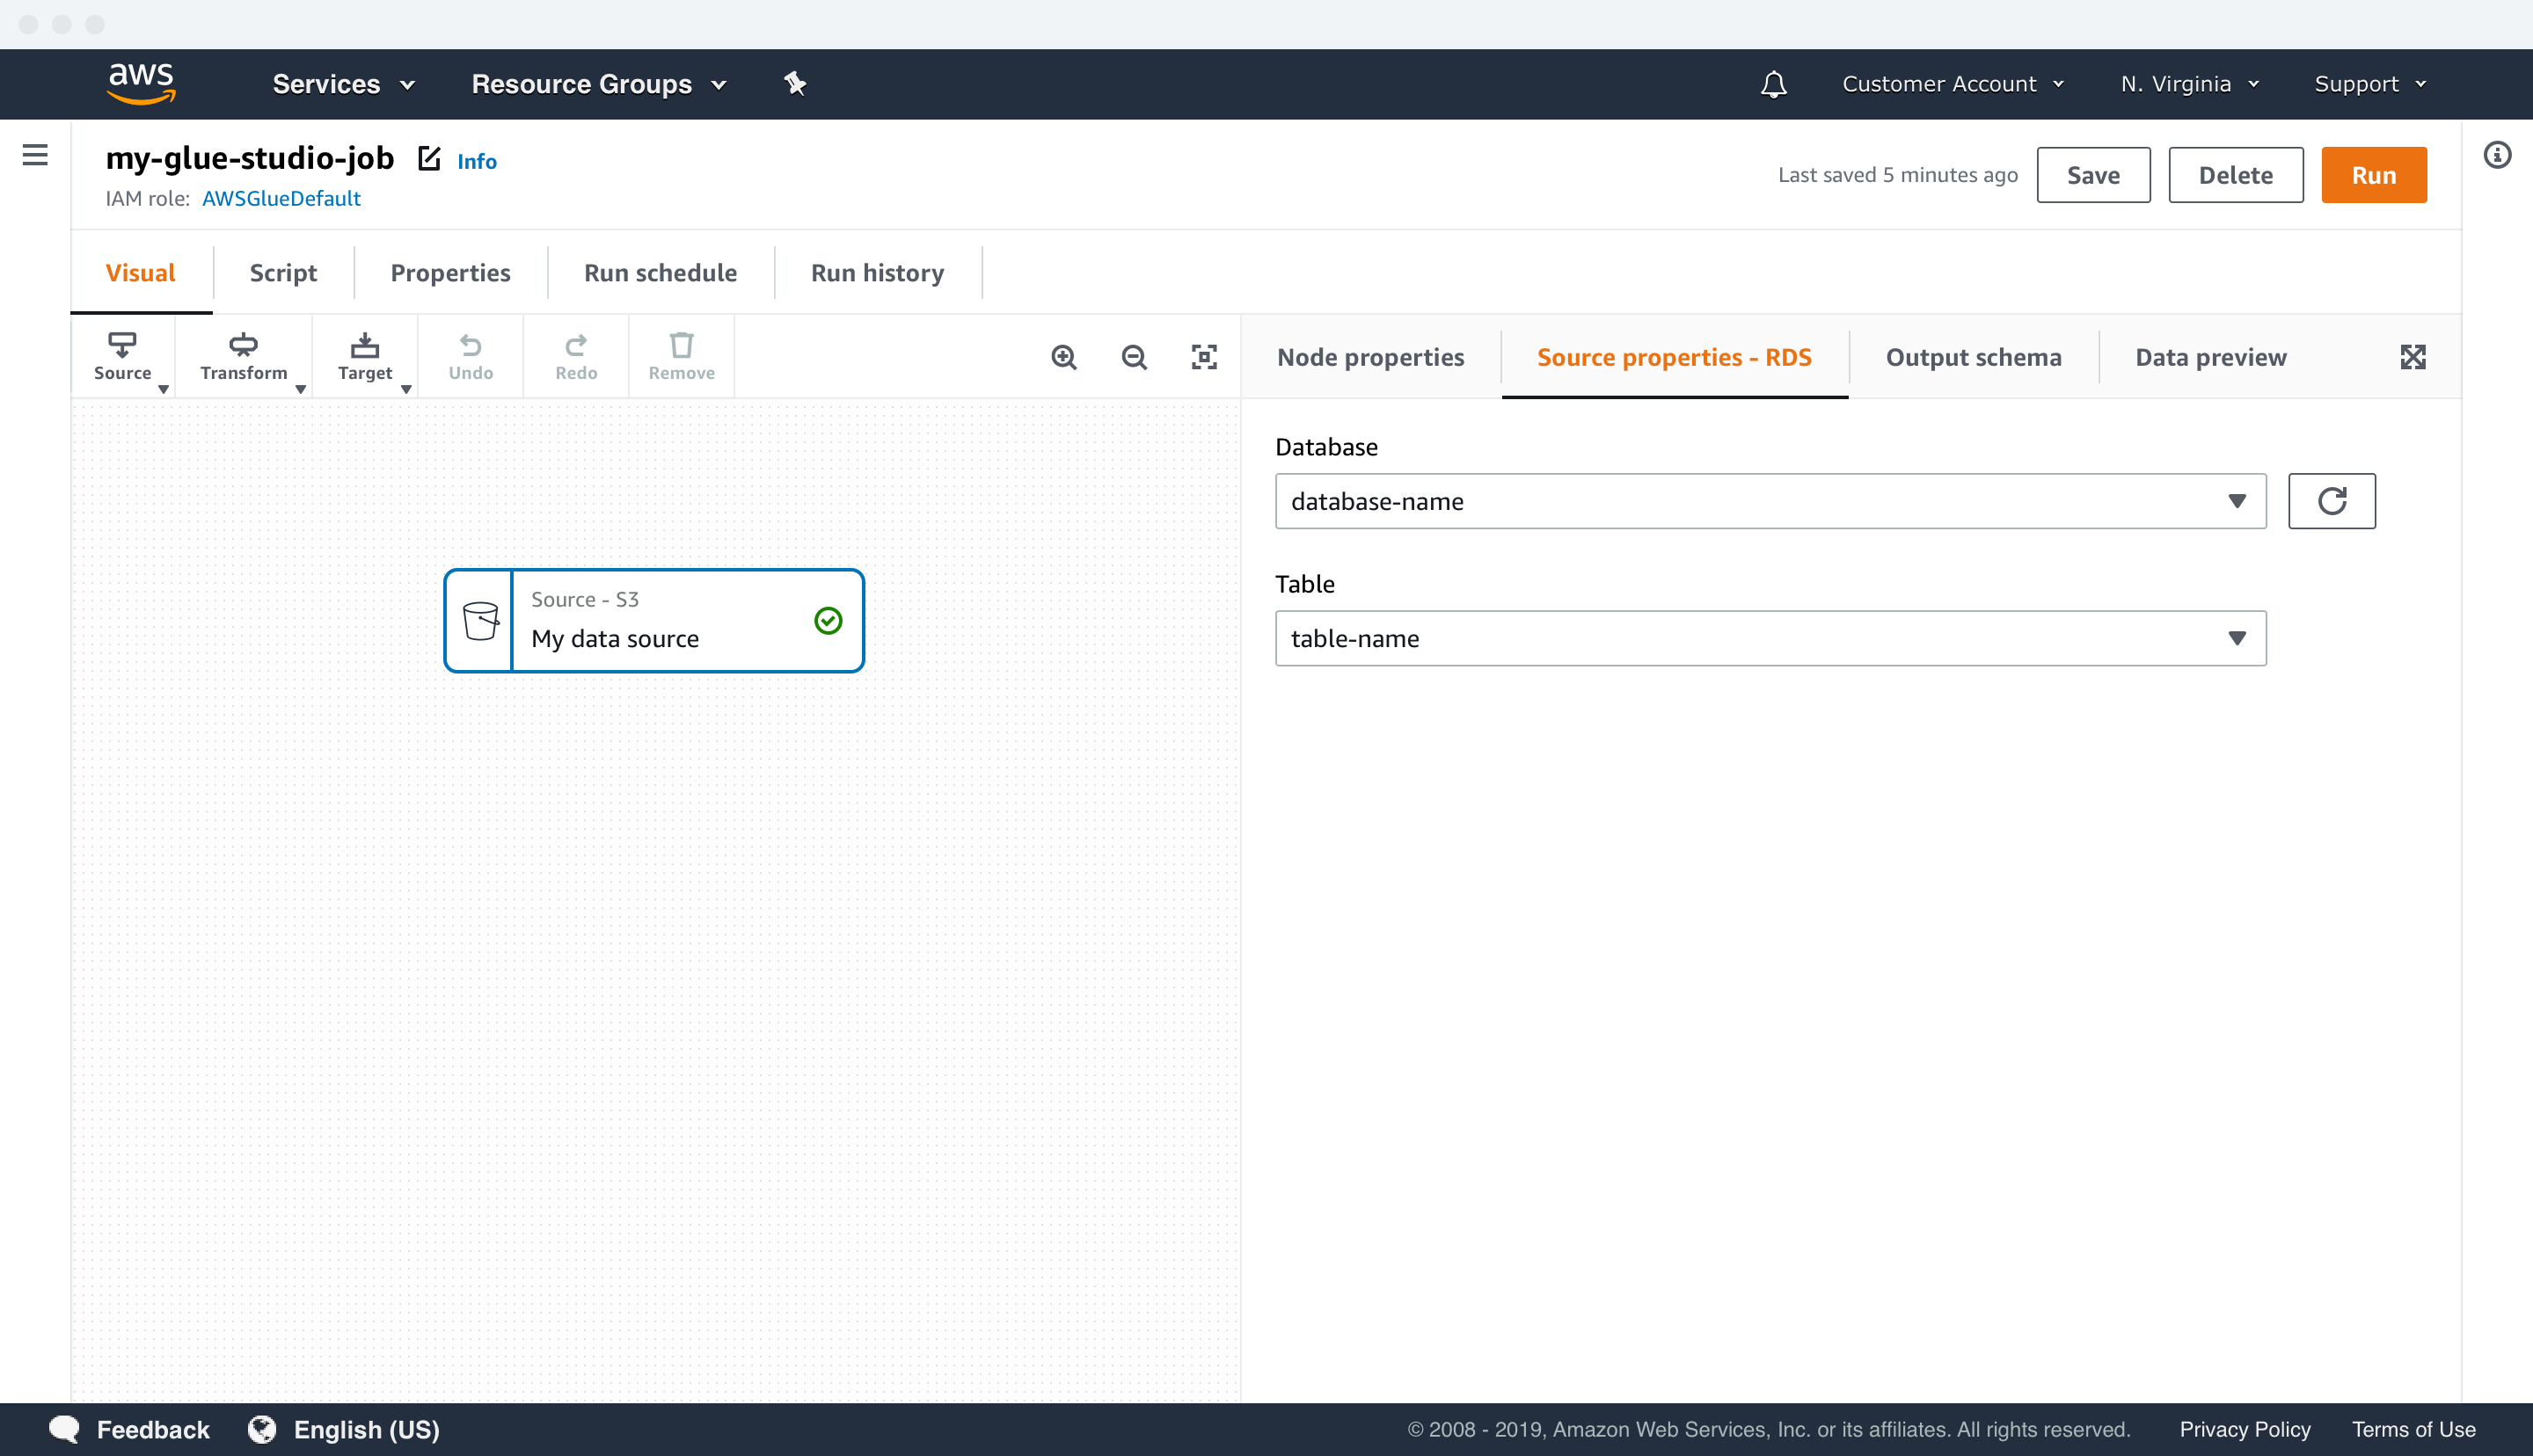
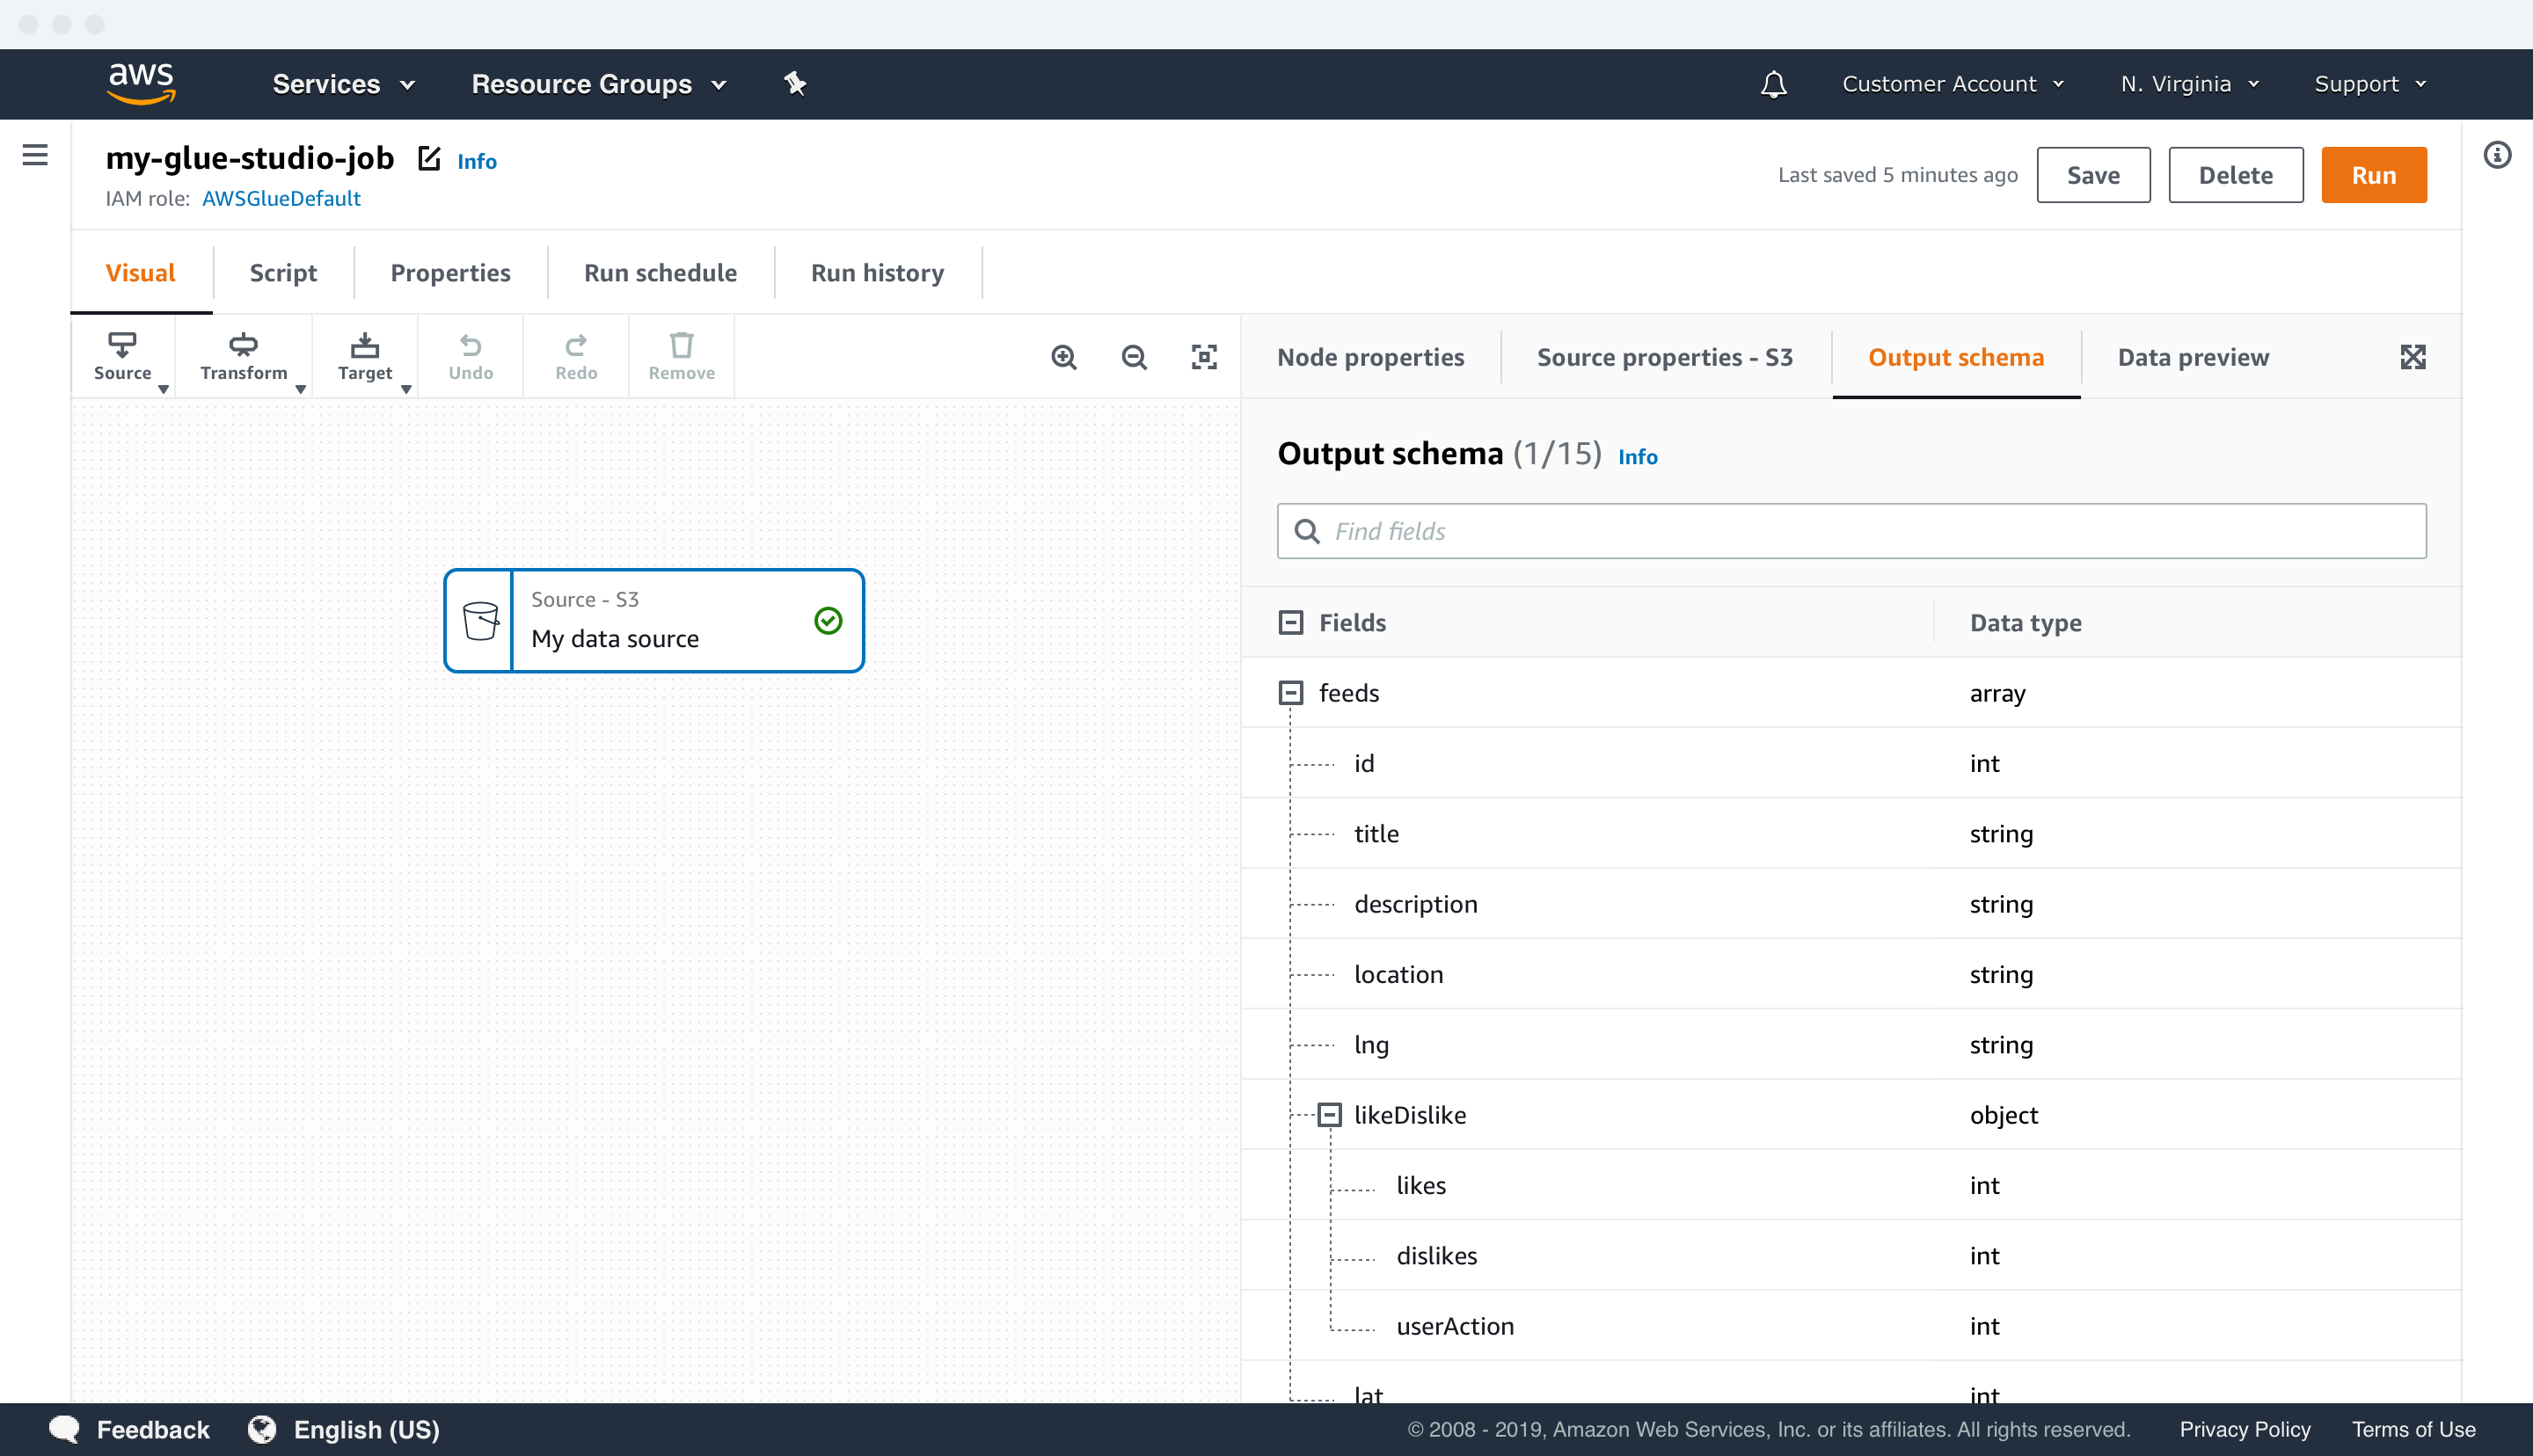
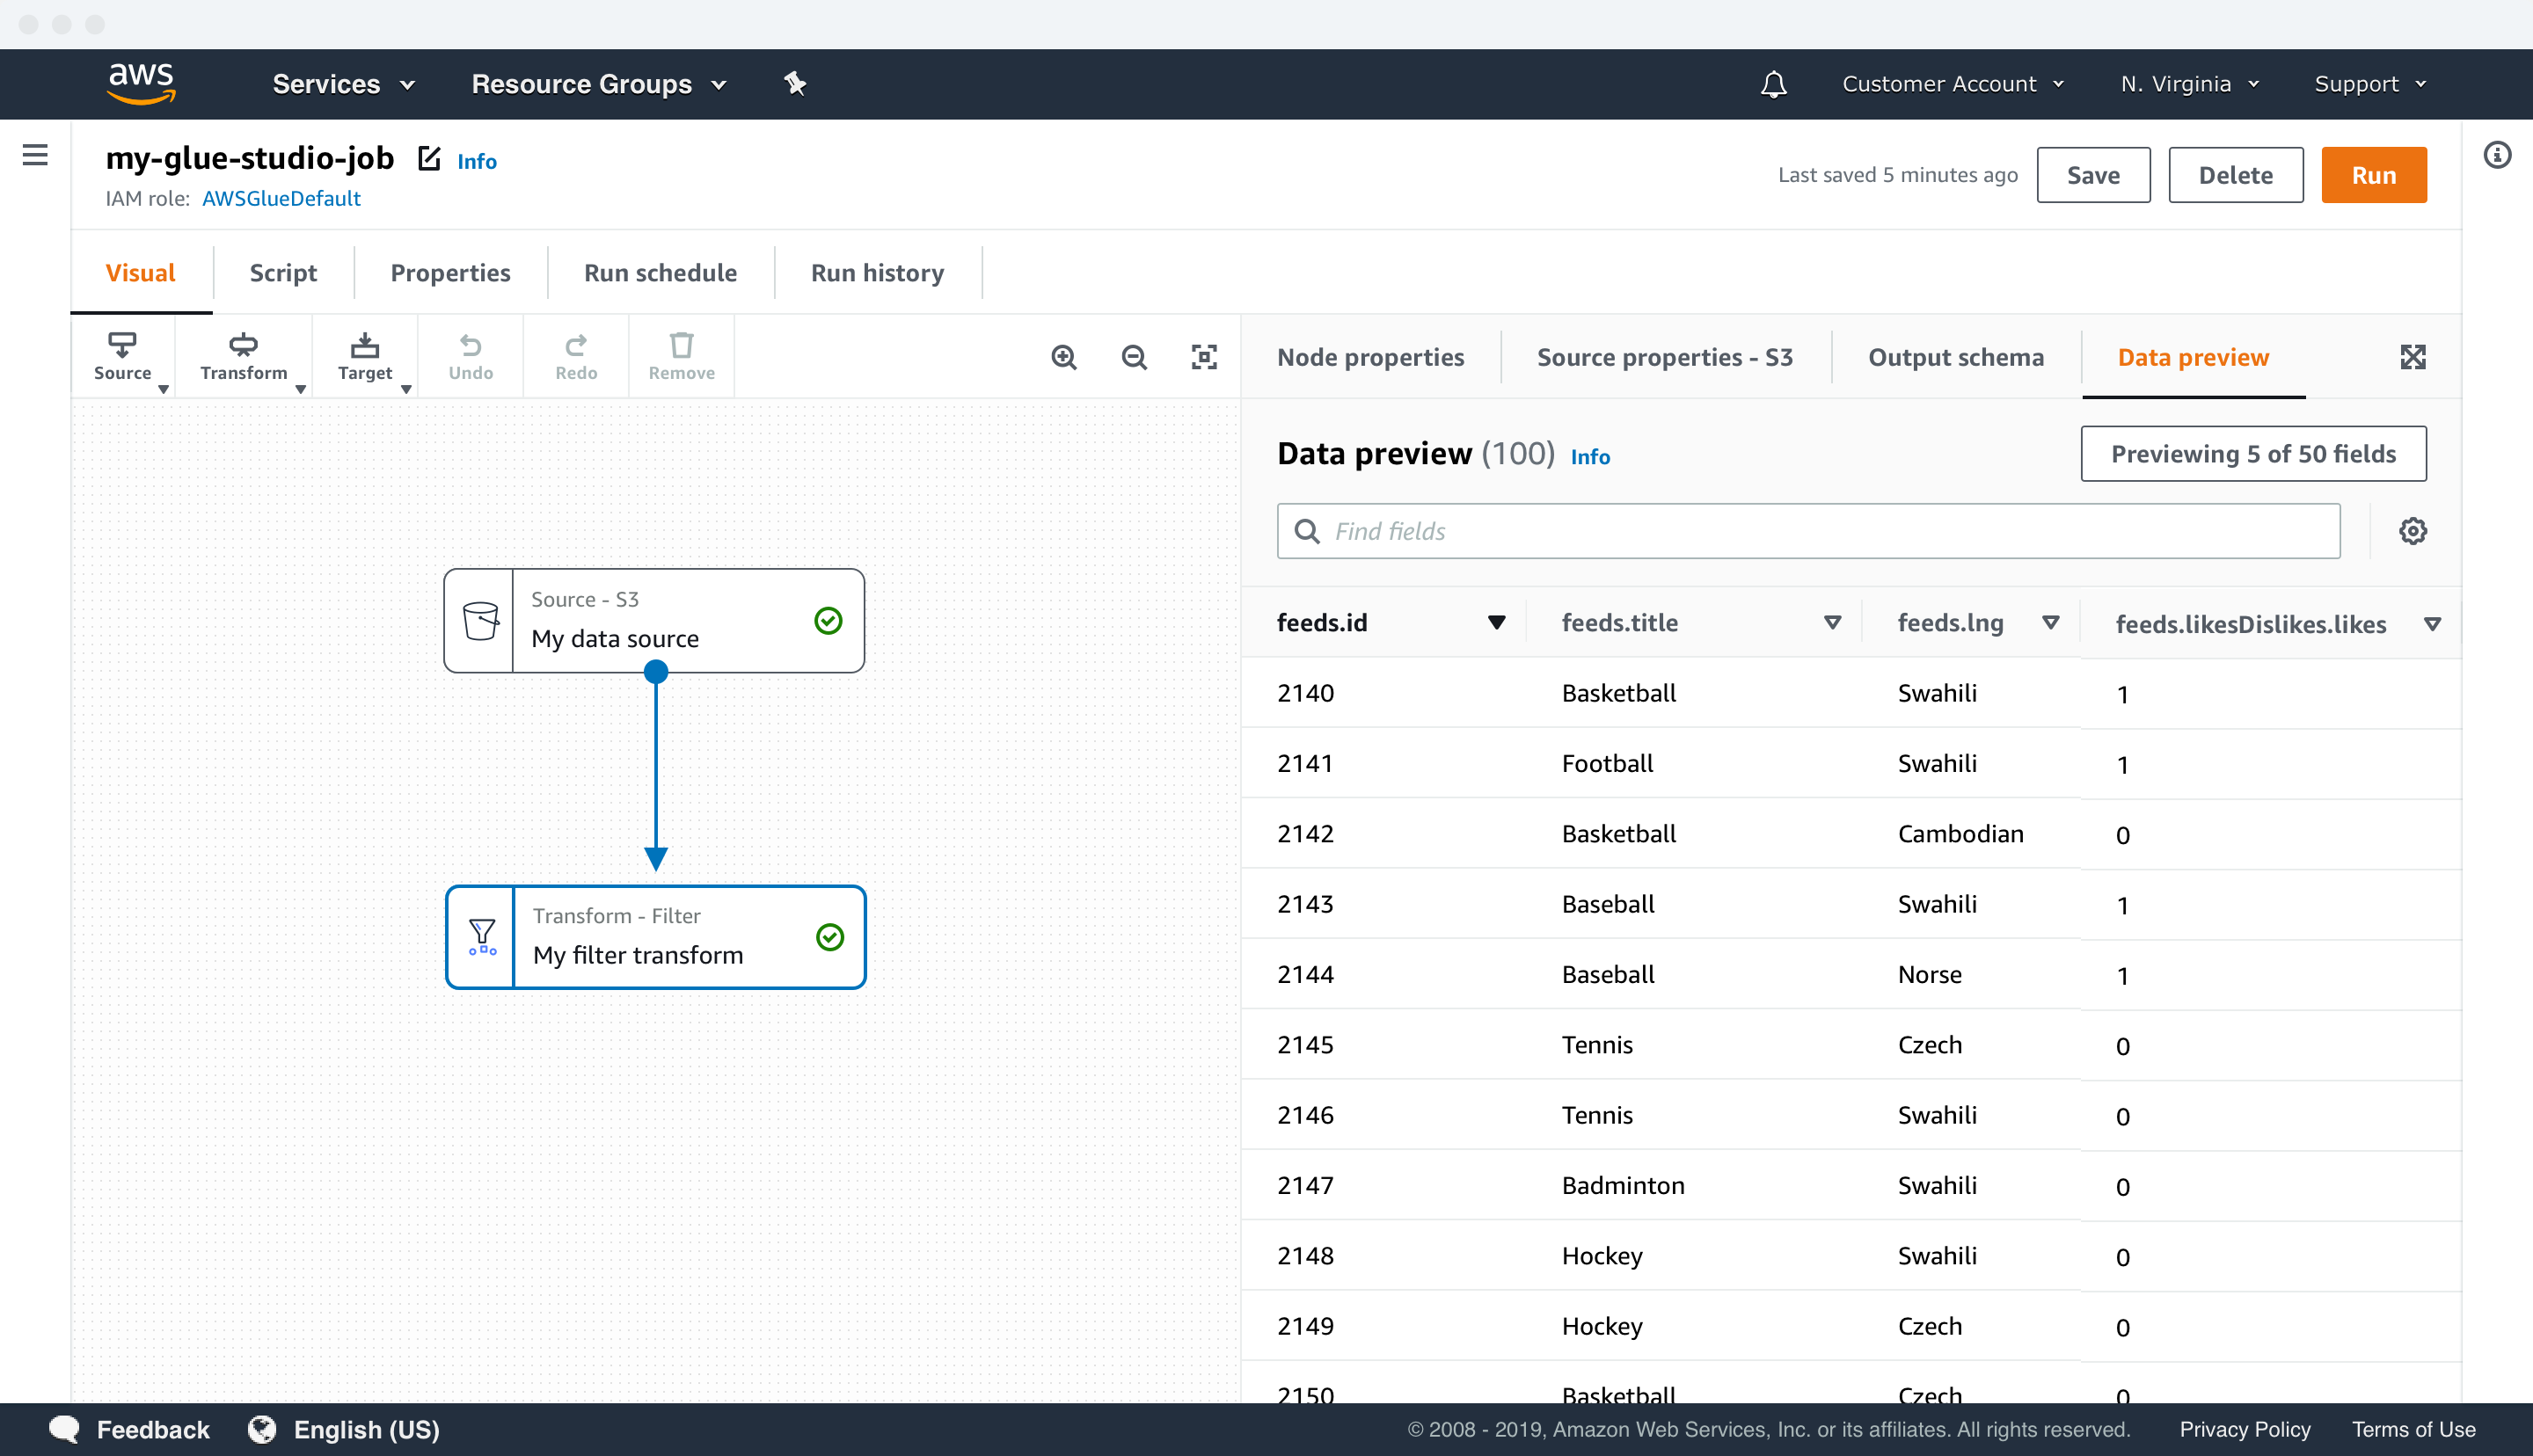
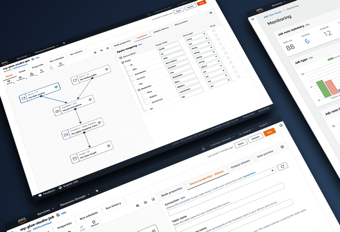
Visual authoring environment
In Glue Studio, customers have a fully interactive graph where they can add and connect nodes representing data sources, transforms, and data targets. For each node in the graph, users can edit its properties and perform data preparation and validation to their Glue job by viewing the data’s schema and a sample data output.
USER FLOW MOCKS
Data transforms
CUSTOMERS WORK WITH VERY COMPLEX DATA
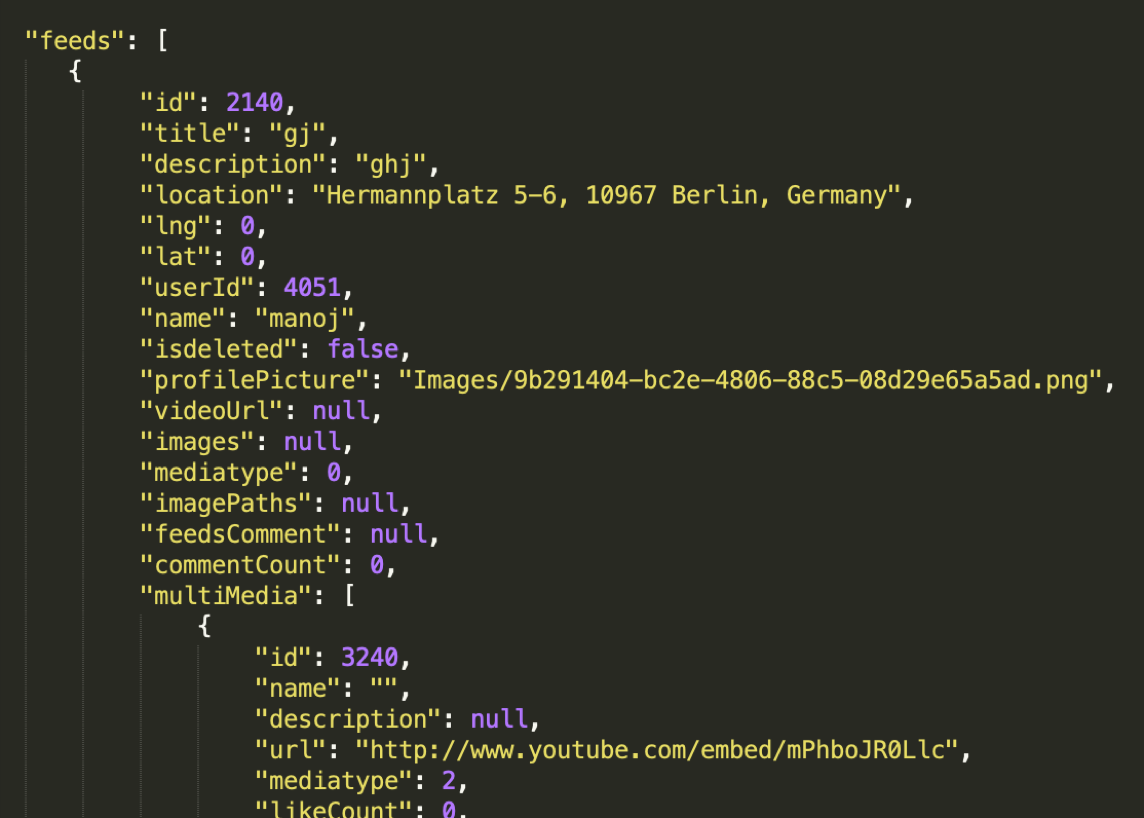
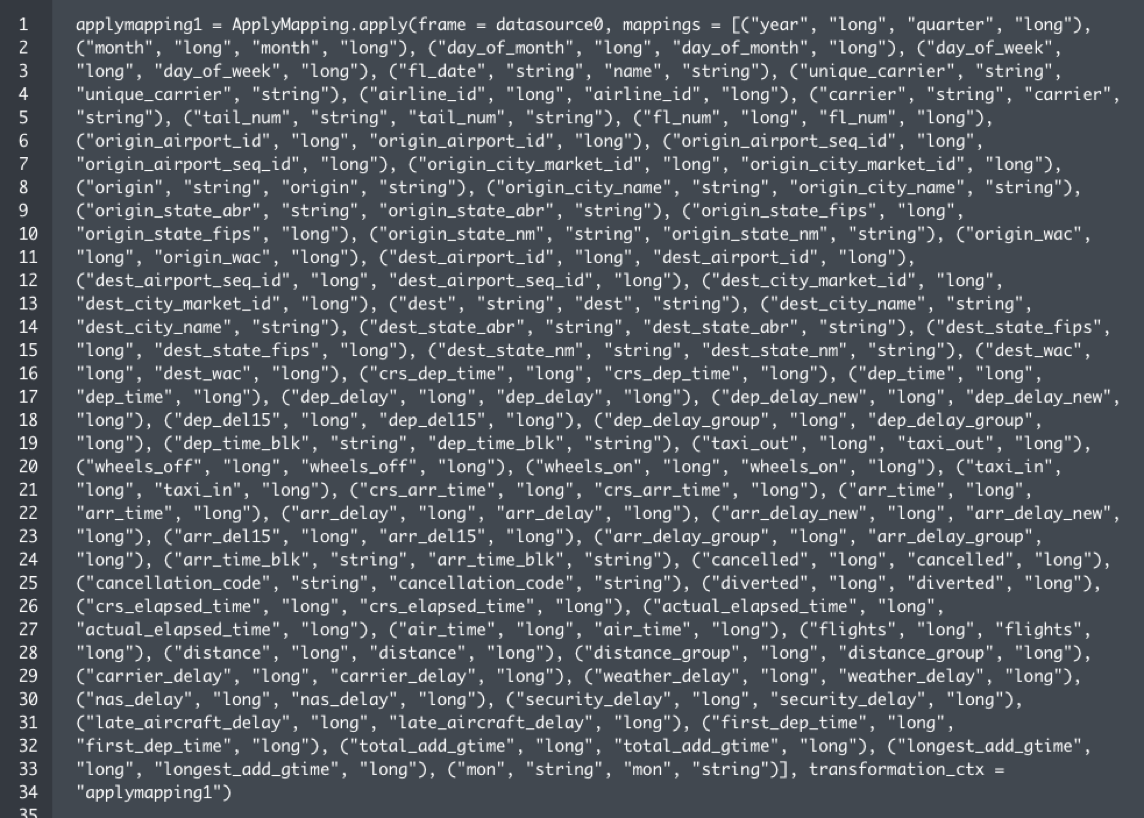
Contextualizing and transforming complex data sets is very hard and error-prone with hand coding. In the example below, the raw JSON data is very large and complex which is a typical case. And, since many transforms involve specifying tuples of data fields by hand coding, users would prefer to do this visually because it’s efficient and accurate.
EXAMPLE OF RAW JSON DATA
EXAMPLE OF A CODED APPLY MAPPING TRANSFORM
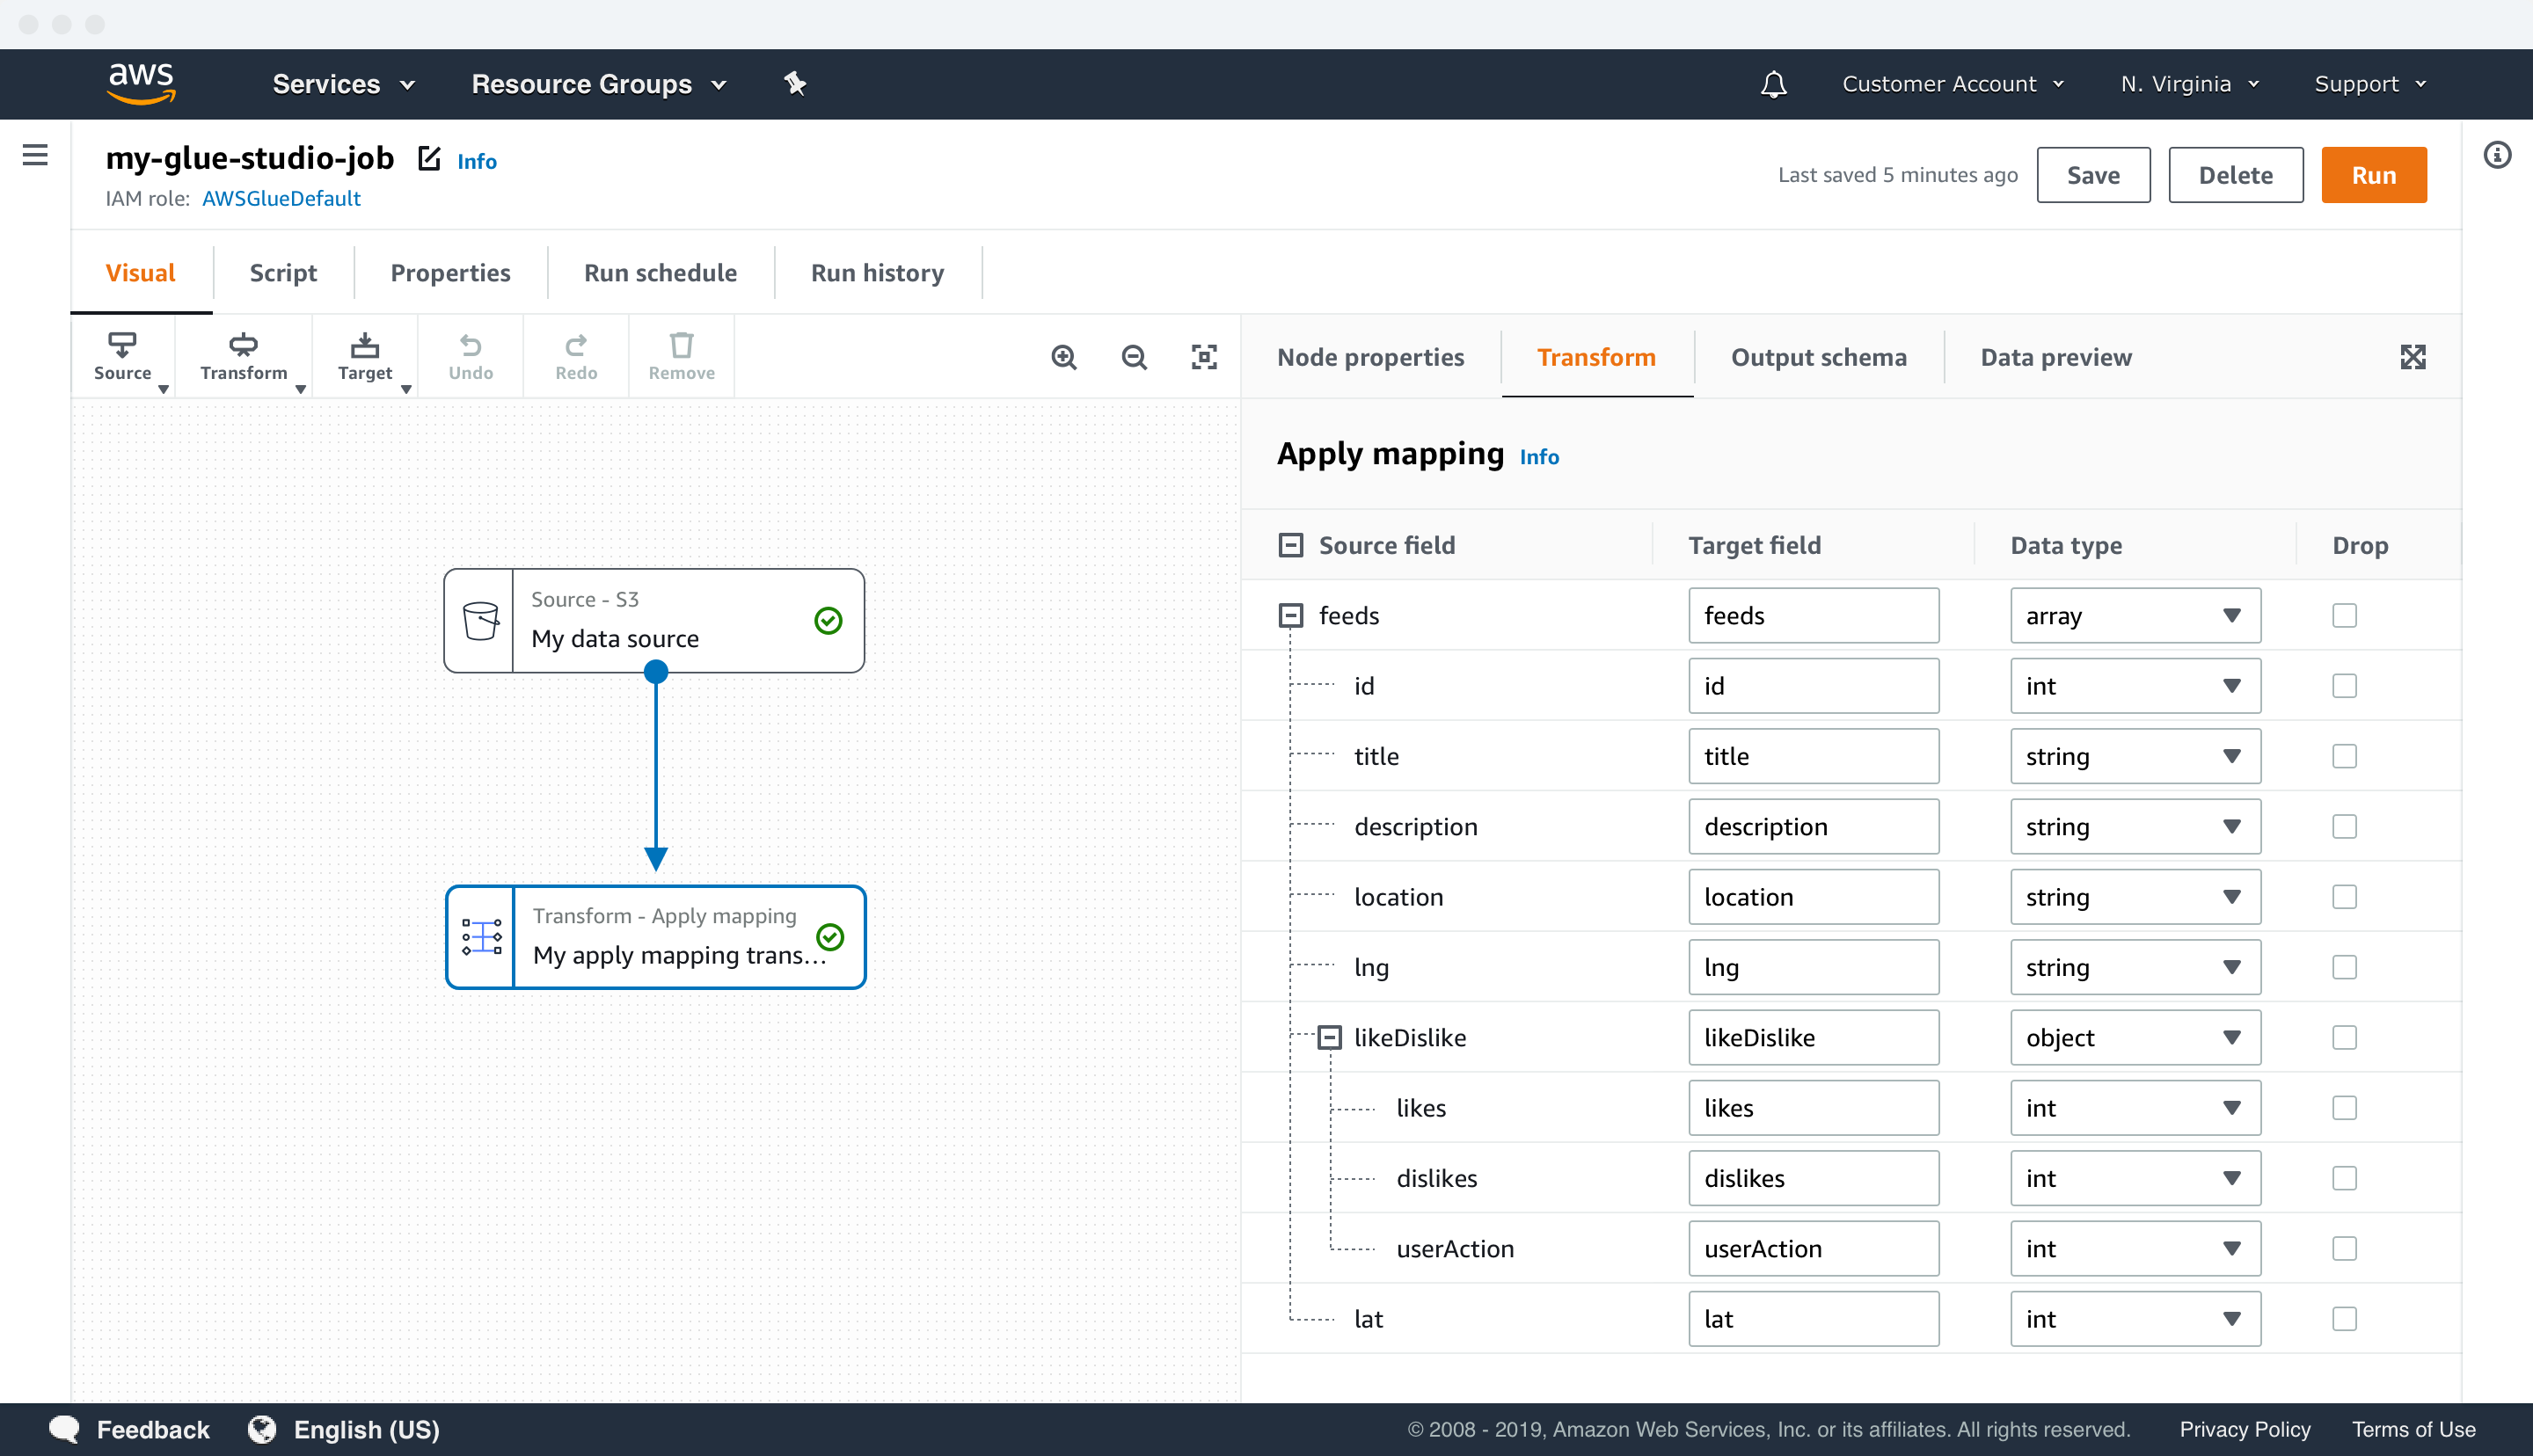
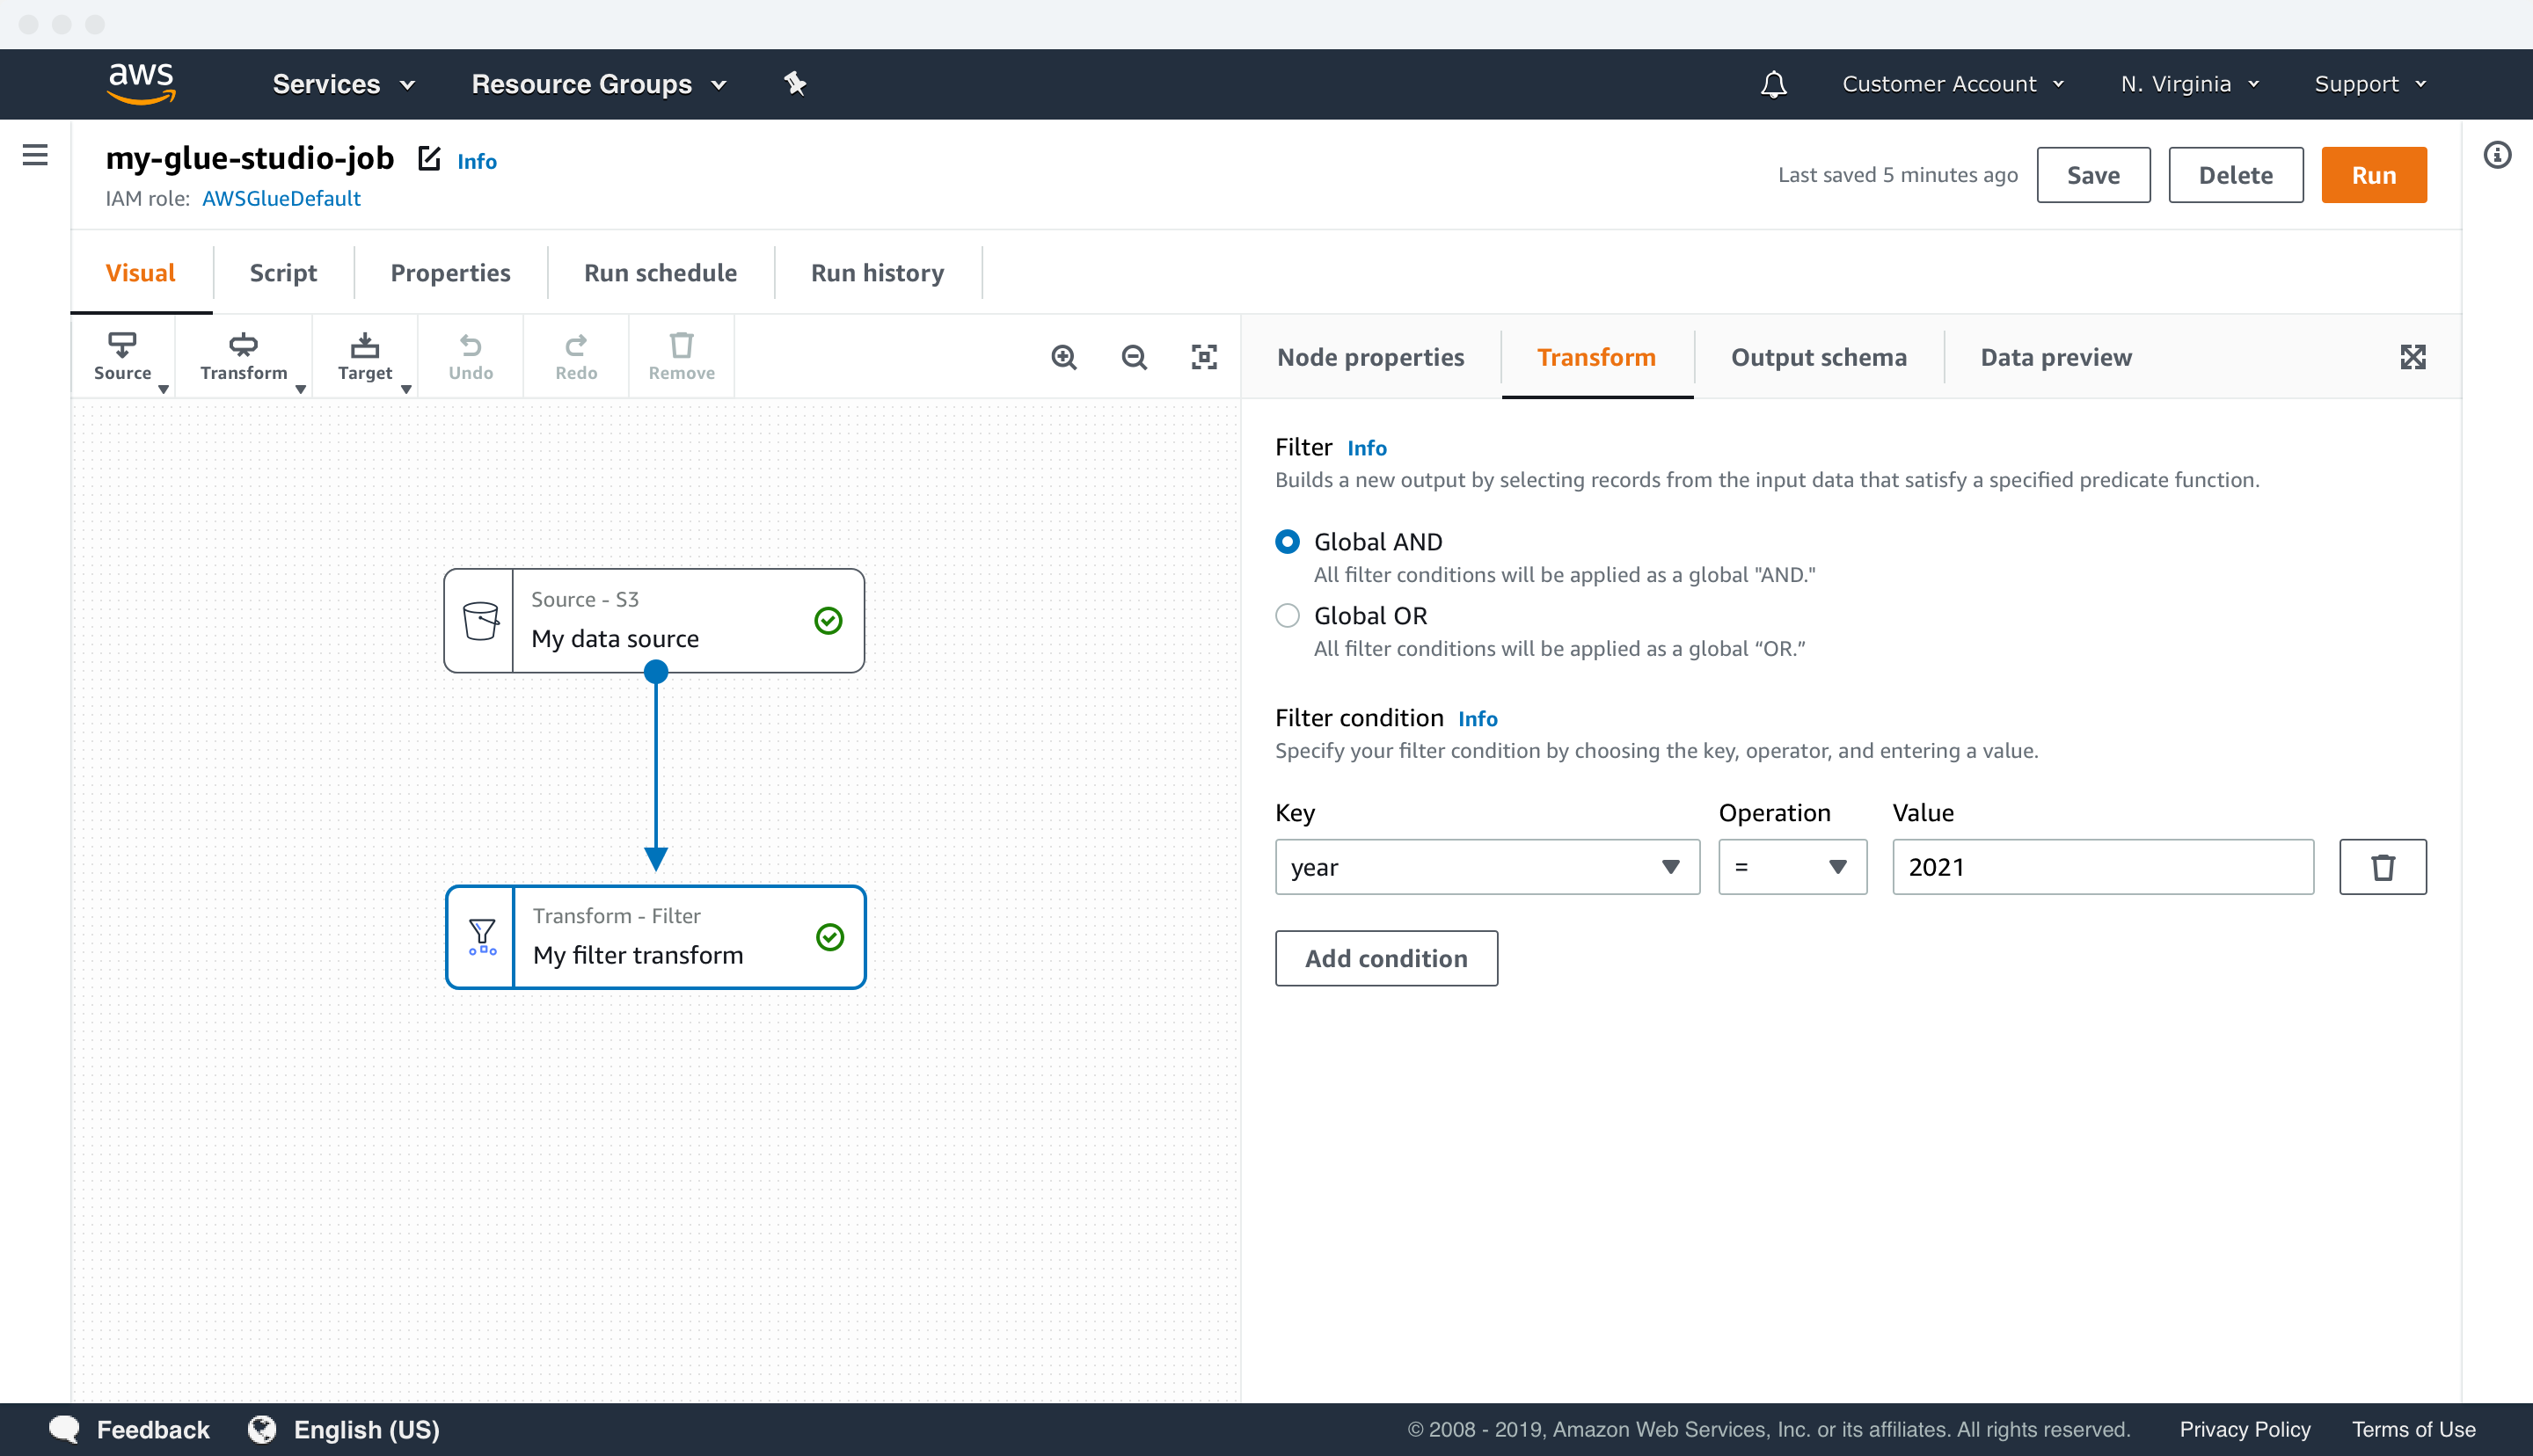
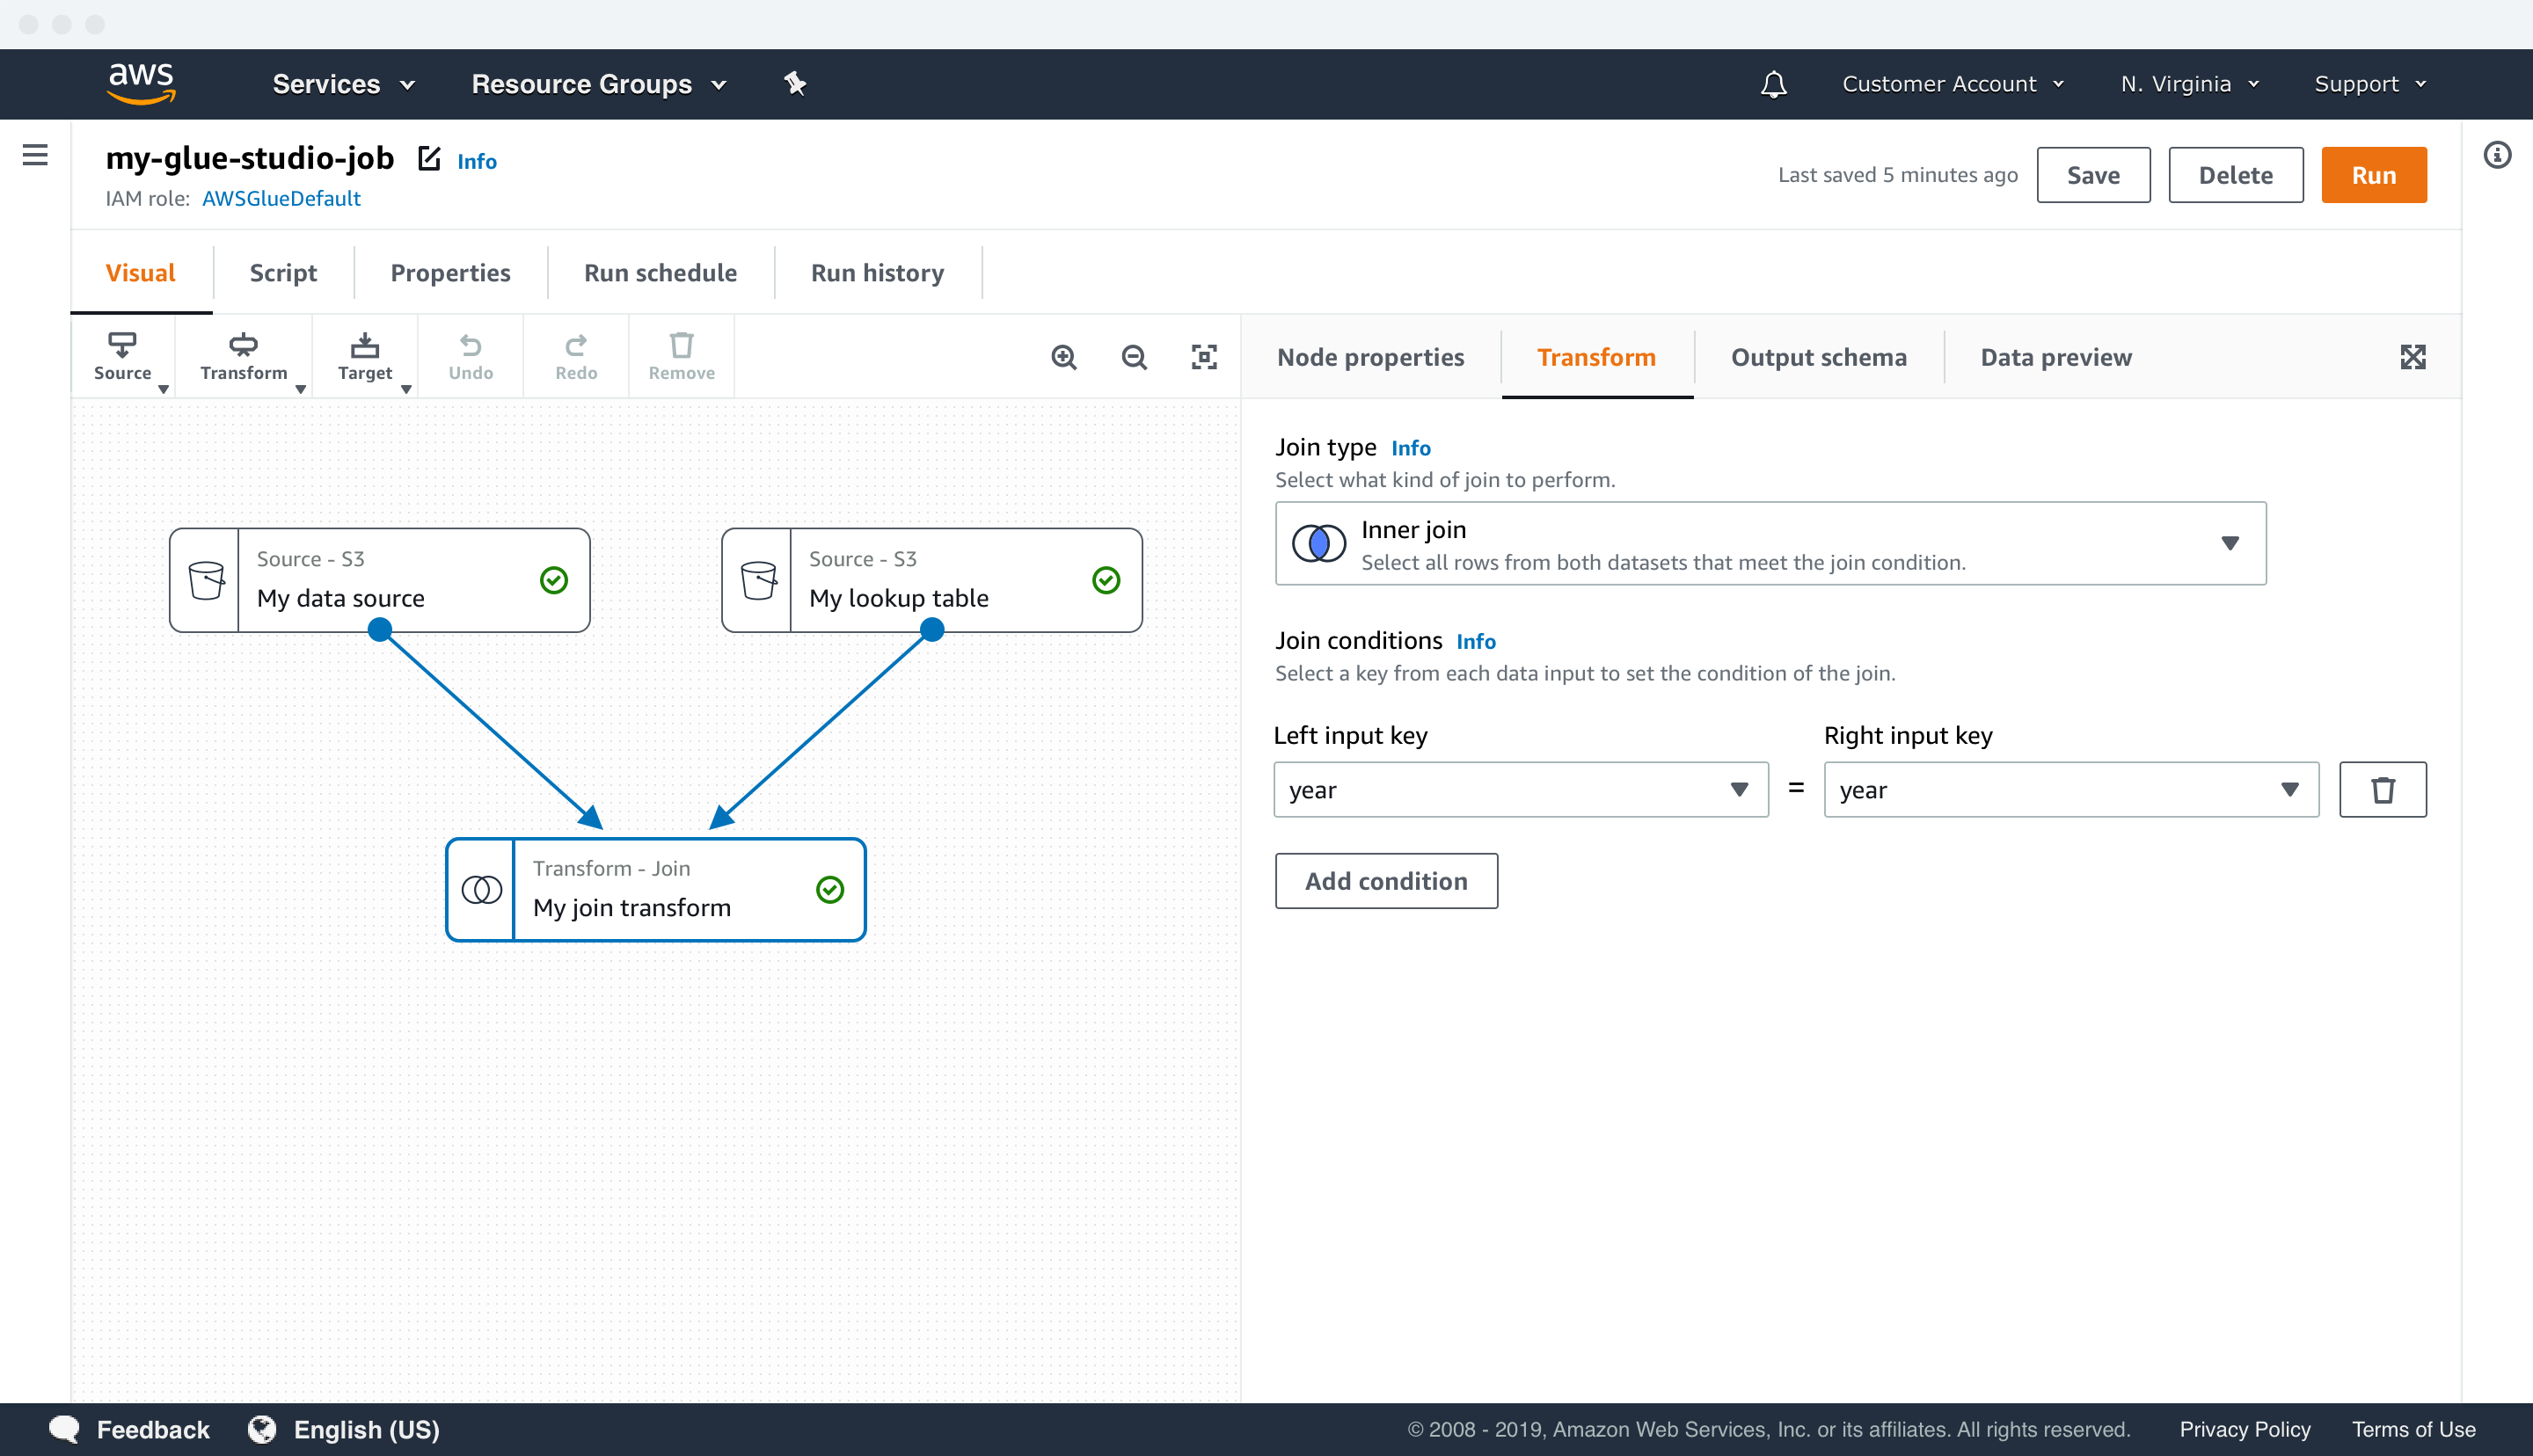
TRANSFORM UI EXAMPLES
Data previews
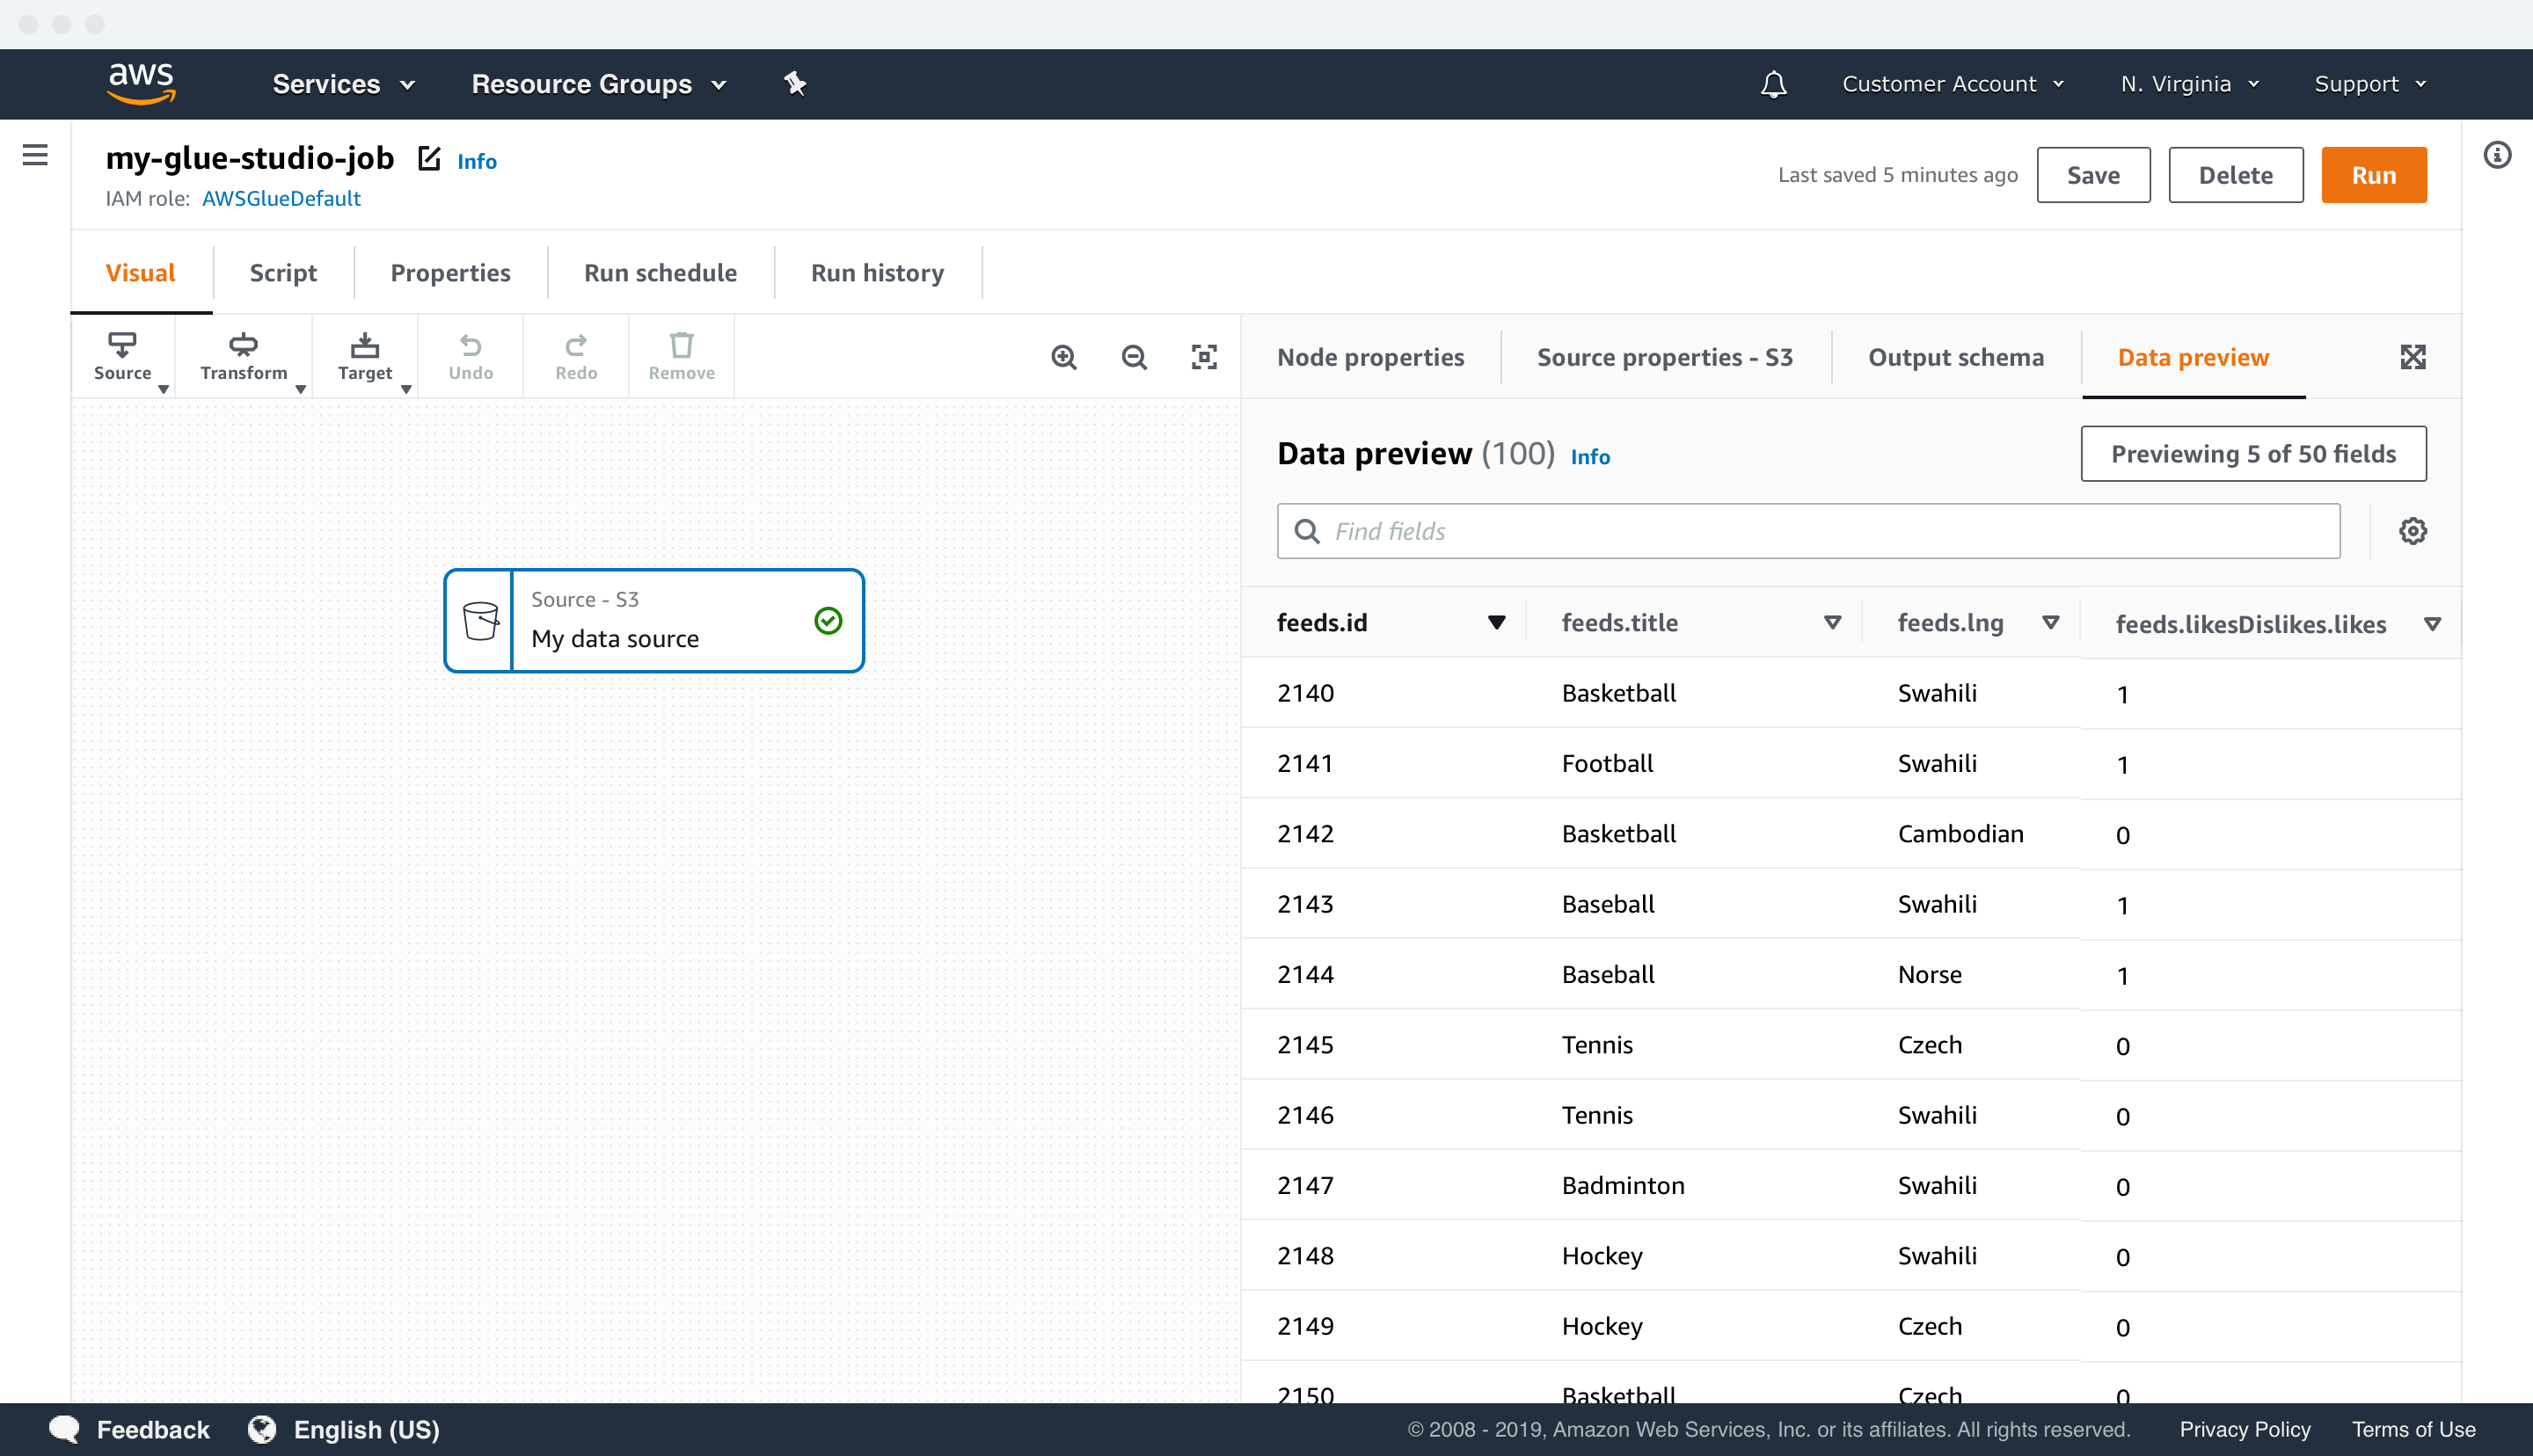
CUSTOMERS SAVE TIME AND MONEY WITH DATA PREVIEWS
Customers wanted to debug their data by previewing it at the authoring level because prior to Glue Studio, they had to do it at the production and management stage. In order to validate their data pipelines, customers would have to test run their Glue jobs, costing time and resources. This process was inefficient and it didn’t align with their mental model.
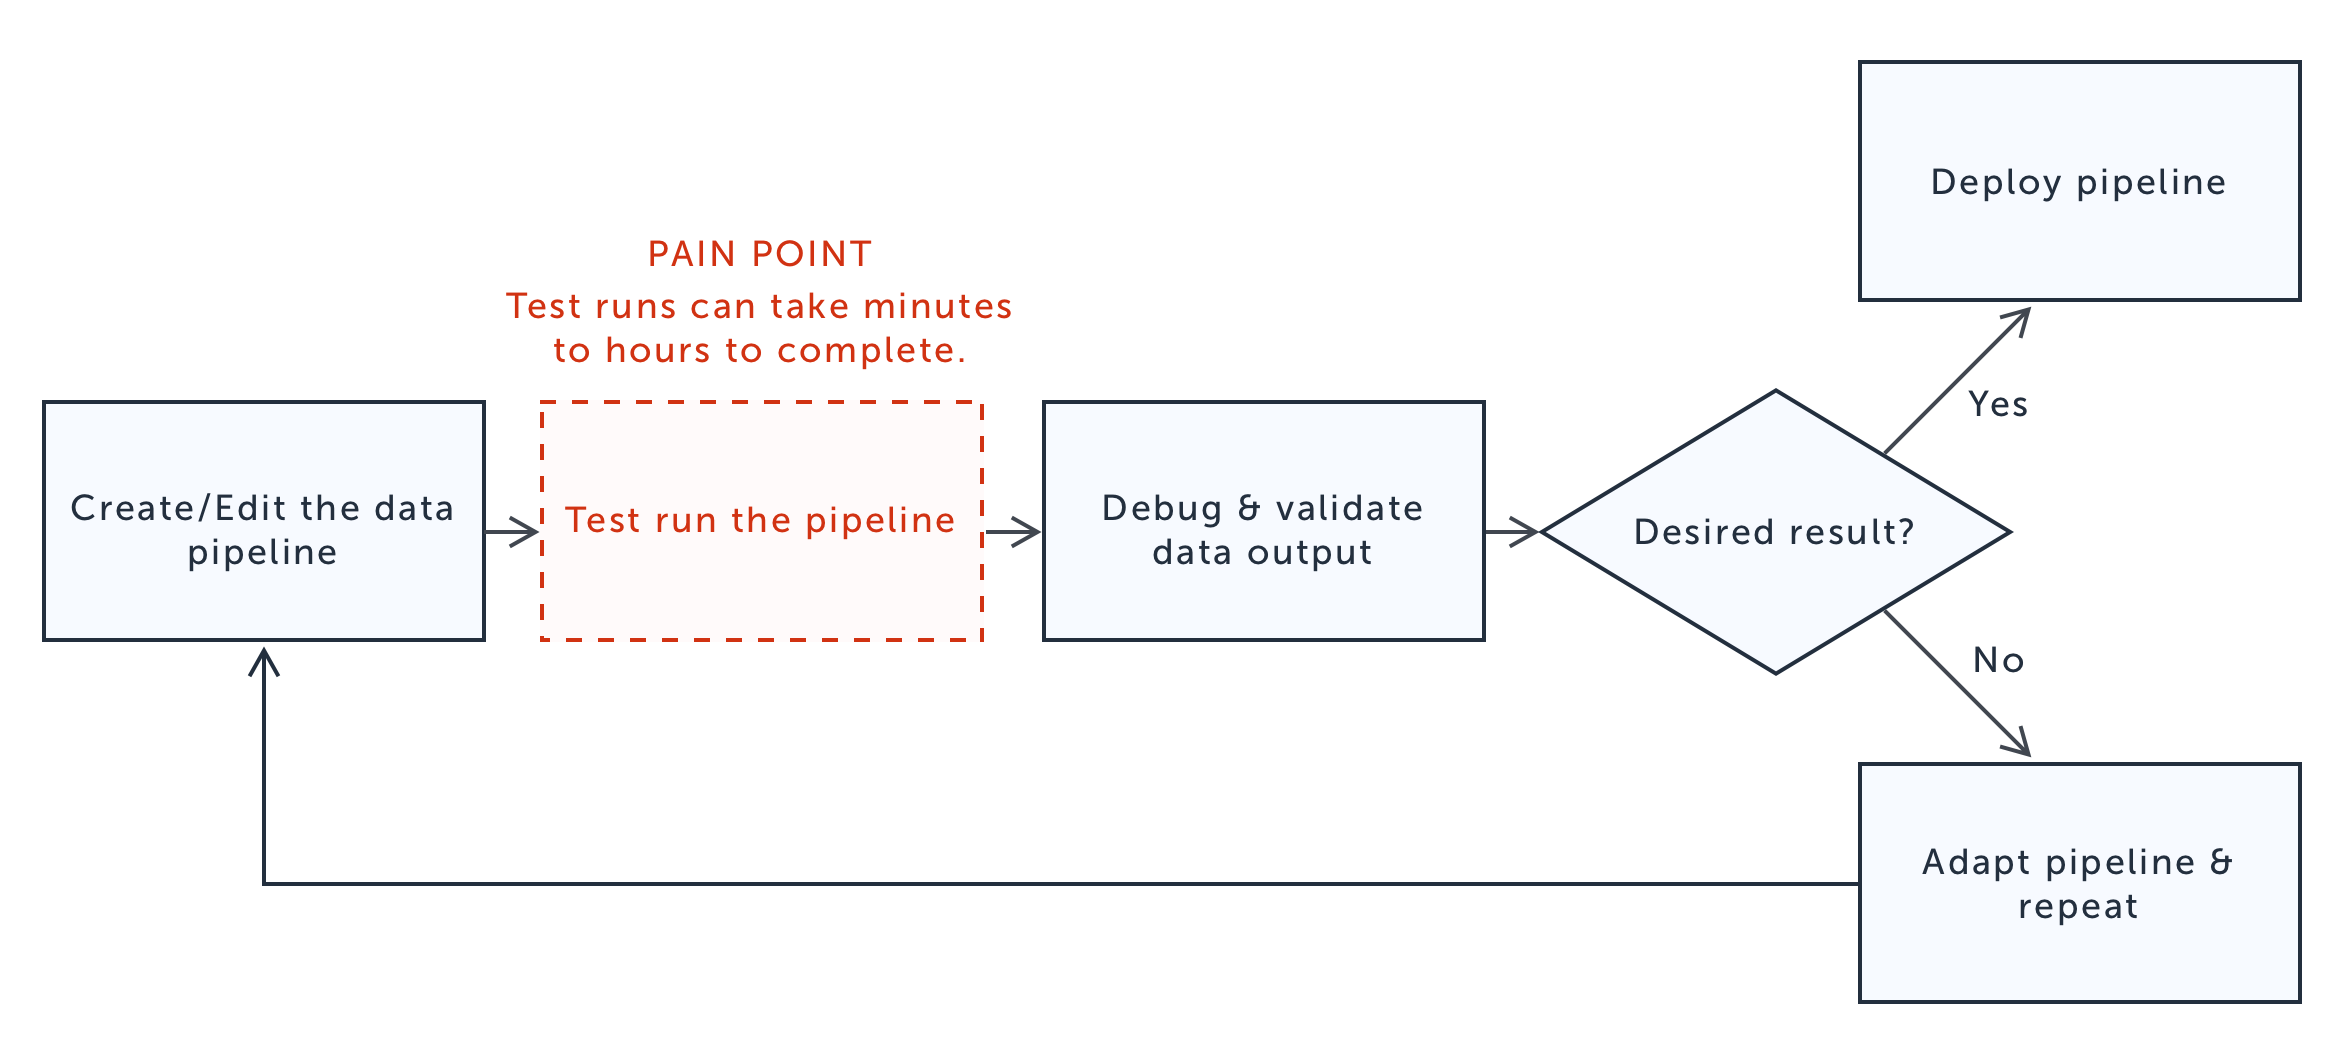
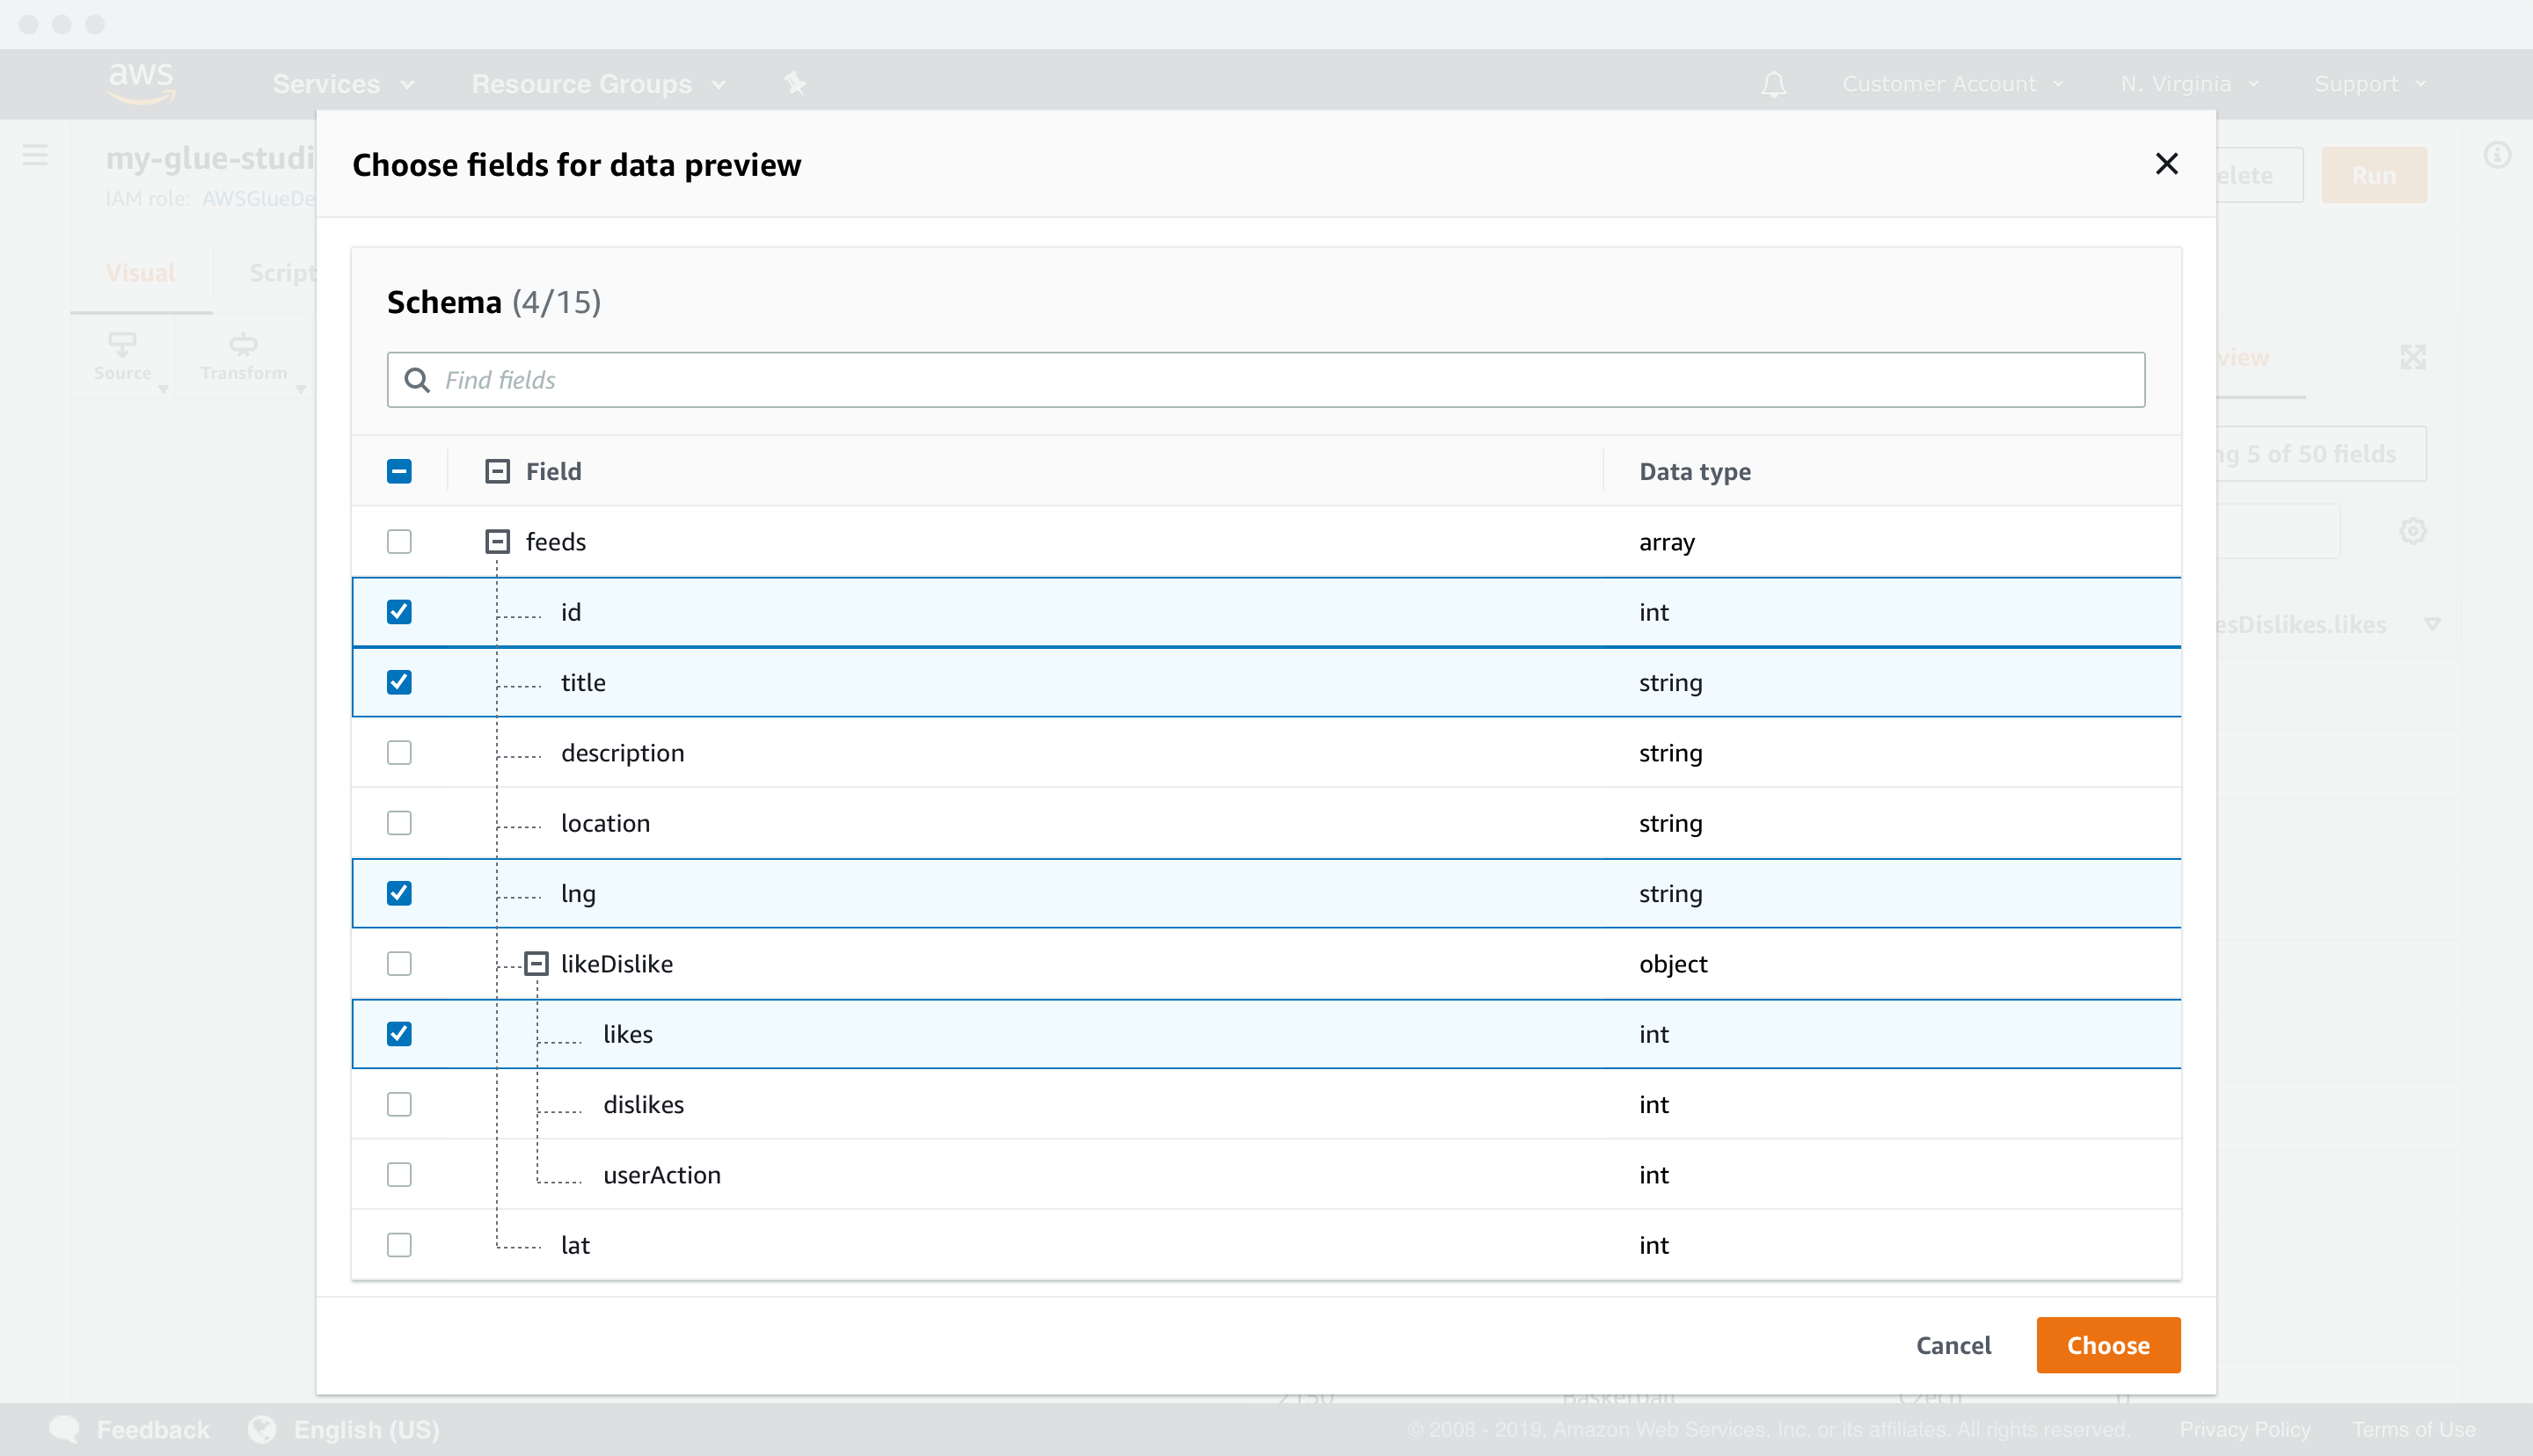
Recent updates in the technology behind Apache Spark and AWS Glue allowed data debugging at the authoring level. Therefore, Glue Studio could solve a critical pain point for customers with data previews by leveraging it. In Glue Studio, customers can preview up to 15 fields and 1000 rows of data in each node of their data pipelines to speed up the data validation process.
USER FLOW MOCKS
Portfolio
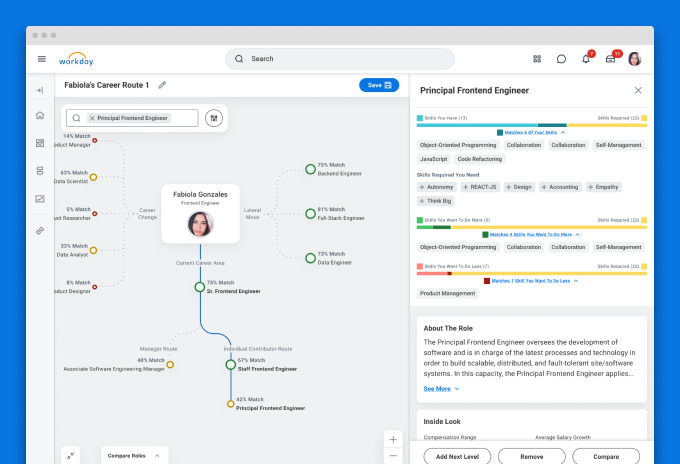
Career exploration for Workday's Career HubProduct Design
AWS Glue StudioUX Case Study
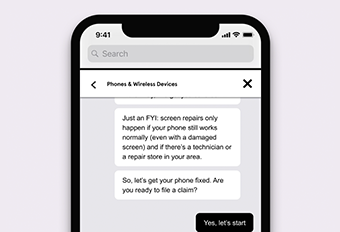
Asurion Virtual AgentUI Design

Other projects for Chase mobileUI-UX Design
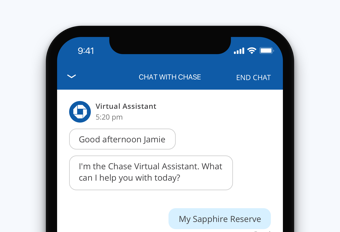
Enhanced chat for Chase mobileUI-UX design
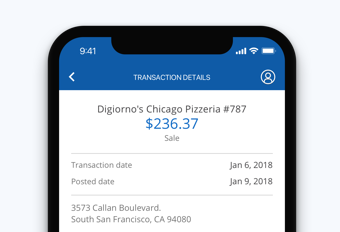
Transaction details for Chase mobileUX Case study

Upgrade systems for Rival FireUX case study

UI for James Bond 007: World of espionageDesign system